Fig. 1
Download original image
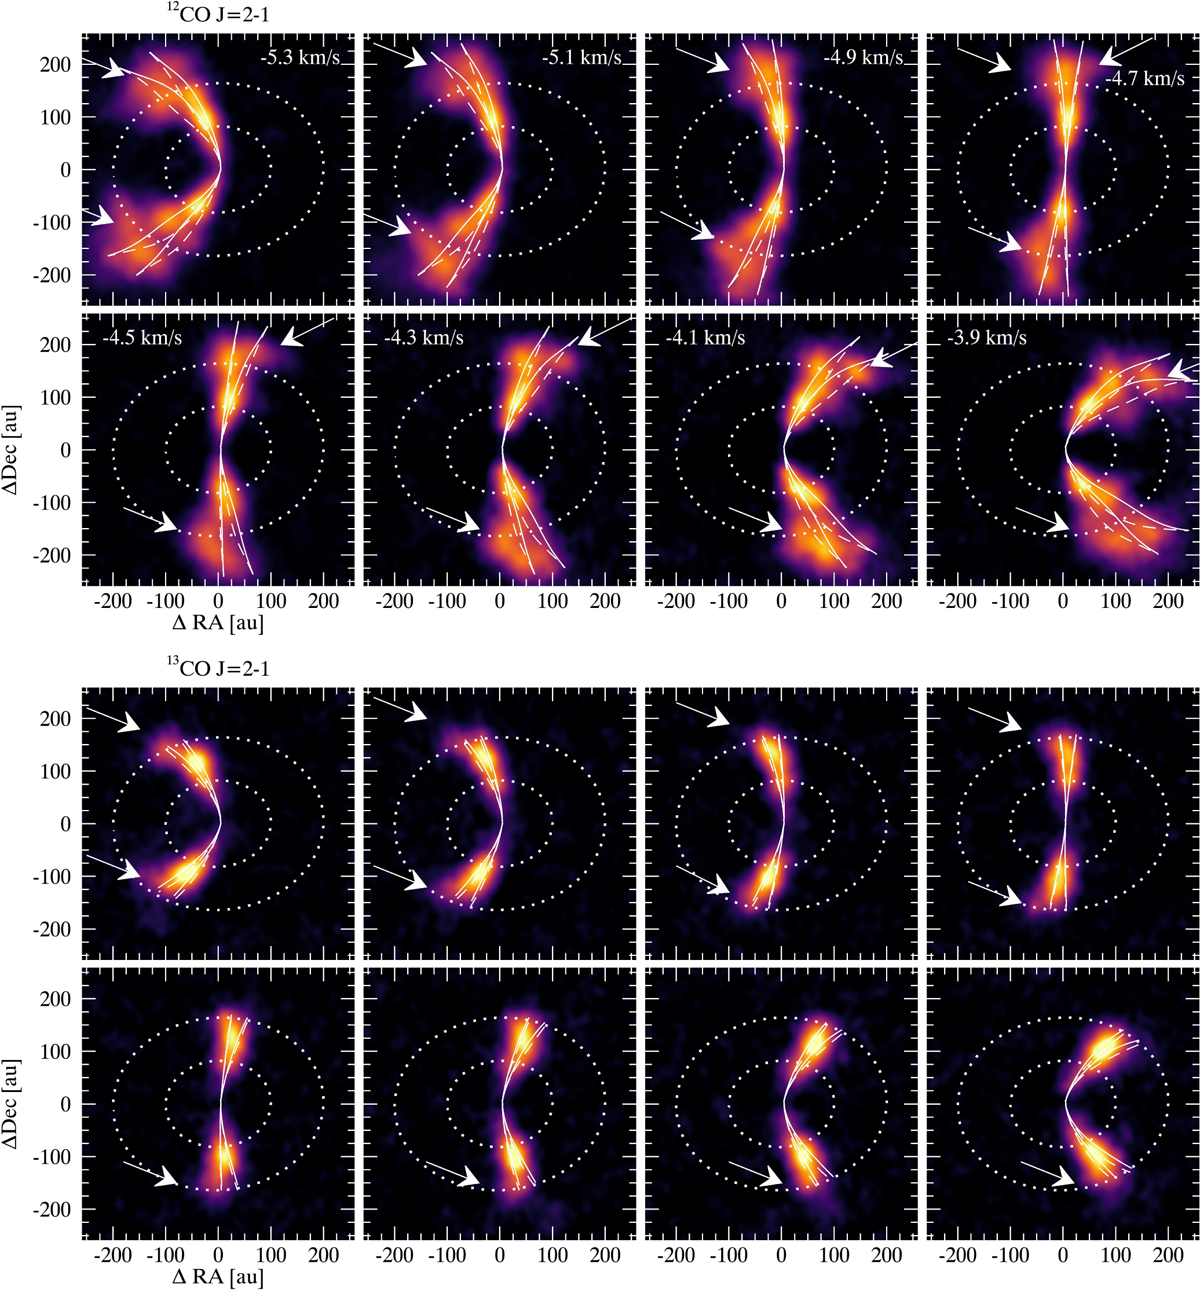
ALMA channels map of AS 209. The figure shows selected velocity channels of 12CO J = 2−1 (top) and 13CO J = 2−1 (bottom). Each panel shows the line emission in a given channel centered at the velocity reported in the top-right corner. The dotted ellipses represent the orbital distances of r = 100 au and r = 200 au at z = 0. The Keplerian isovelocity region was overlaid for the top (solid line) and bottom (dashed) surfaces (see Sect. 3). The arrows point to the deviation from Keplerian velocity. The deviation is detected in multiple channels and over a wide range of azimuth angles both in the 12CO and in the 13CO channels maps.
Current usage metrics show cumulative count of Article Views (full-text article views including HTML views, PDF and ePub downloads, according to the available data) and Abstracts Views on Vision4Press platform.
Data correspond to usage on the plateform after 2015. The current usage metrics is available 48-96 hours after online publication and is updated daily on week days.
Initial download of the metrics may take a while.