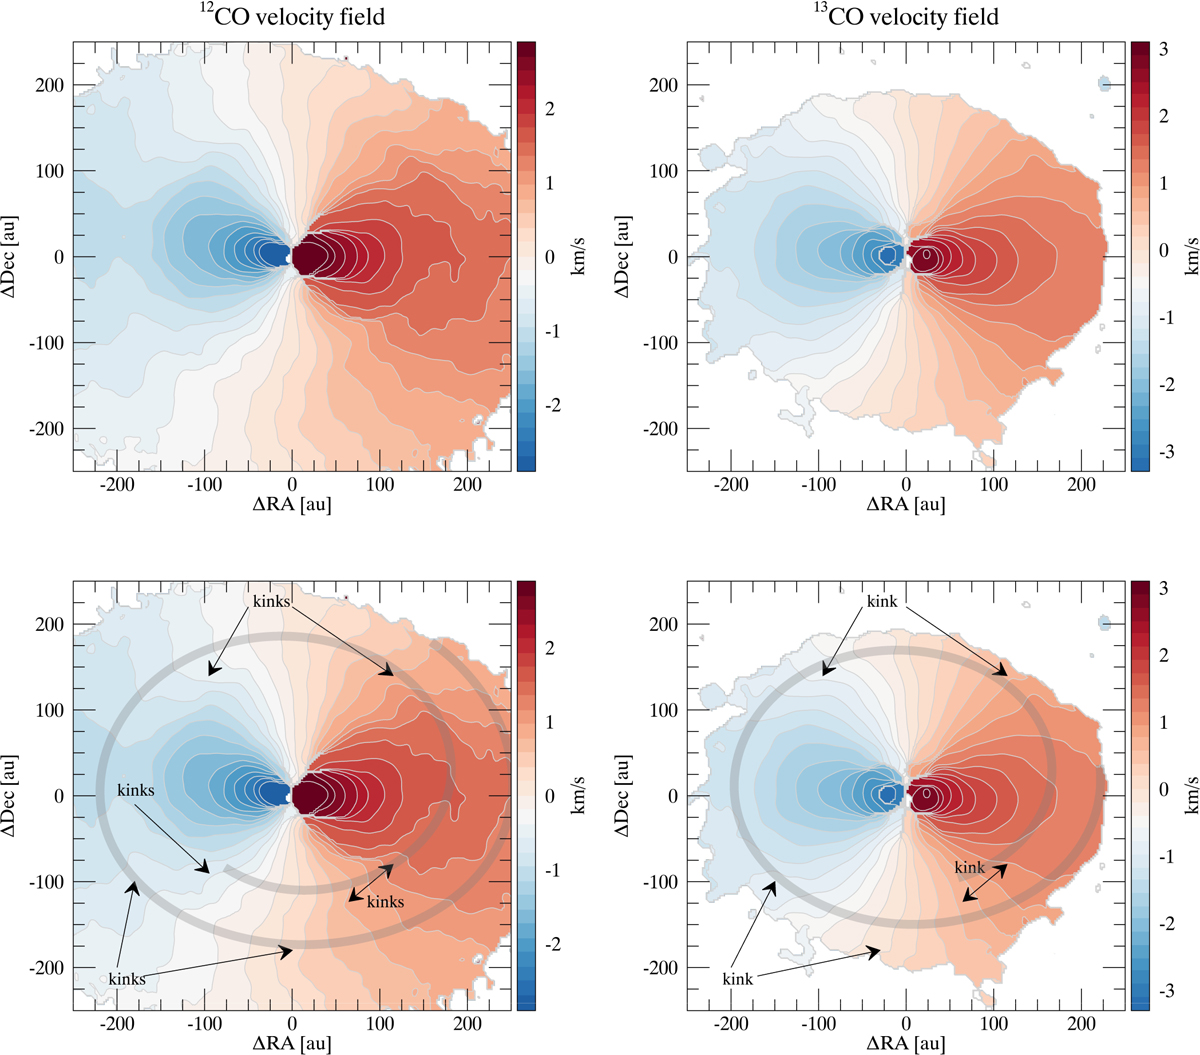
Fig. 2
Download original image
Velocity map of the peak intensity. The figure shows the velocity map of 12CO (left) and 13CO (right) J = −2−1 in the LSR rest frame. The bottom panels show the same maps with the most prominent kinks indicated by the arrows. The large-scale structure of the kink resembles a spiral wake, tentatively represented by the thick gray line.
Current usage metrics show cumulative count of Article Views (full-text article views including HTML views, PDF and ePub downloads, according to the available data) and Abstracts Views on Vision4Press platform.
Data correspond to usage on the plateform after 2015. The current usage metrics is available 48-96 hours after online publication and is updated daily on week days.
Initial download of the metrics may take a while.