Fig. B.2
Download original image
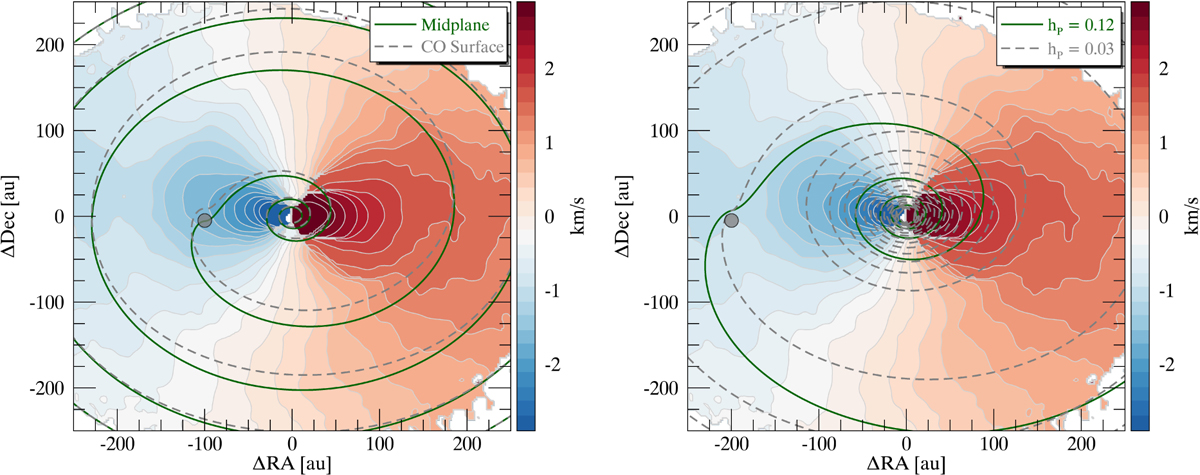
Velocity map of 12CO. The figure shows the analytic spiral wake overlaid on top of the 12CO velocity map. The gray dot in each image indicates the position of the planet at the midplane. (left) Spiral wake for RP = 100 au. The two curves show the spiral wake at the midplane (green solid line) and the CO top surface layer (dashed gray line). (right) spiral wake for RP= 200 au. The two curves show the wake (projected on the CO top surface layer) for two different values of hP.
Current usage metrics show cumulative count of Article Views (full-text article views including HTML views, PDF and ePub downloads, according to the available data) and Abstracts Views on Vision4Press platform.
Data correspond to usage on the plateform after 2015. The current usage metrics is available 48-96 hours after online publication and is updated daily on week days.
Initial download of the metrics may take a while.