Fig. B.1
Download original image
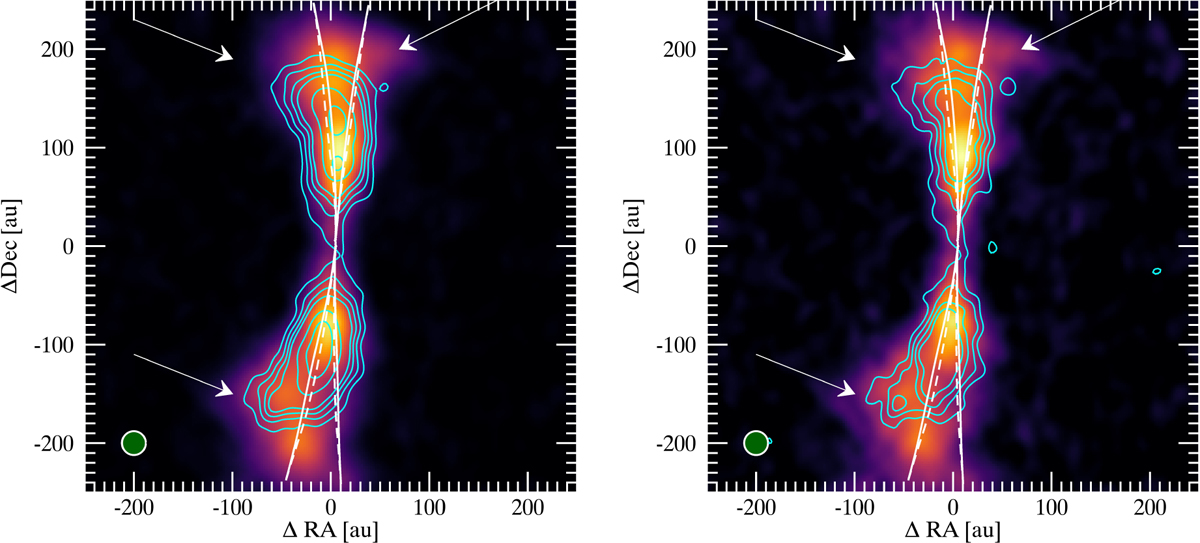
Central velocity channel. (left) JvM-Corrected image of the central velocity channel. (right) Uncorrected JvM image of the central velocity channel. The cyan contours indicate the 13CO emission. The white lines represent the expected contours in the case of the Keplerian profile for the top (solid) and bottom (dashed) surface (eq. 2). The arrows point to the main deviation from the Keplerian velocity. The restored beam of 072 is shown in the bottom-left corner as a green circle. The 13CO contours are plotted at 3, 5, 7, 9, 15, and 20σ.
Current usage metrics show cumulative count of Article Views (full-text article views including HTML views, PDF and ePub downloads, according to the available data) and Abstracts Views on Vision4Press platform.
Data correspond to usage on the plateform after 2015. The current usage metrics is available 48-96 hours after online publication and is updated daily on week days.
Initial download of the metrics may take a while.