| Issue |
A&A
Volume 663, July 2022
|
|
|---|---|---|
| Article Number | A117 | |
| Number of page(s) | 17 | |
| Section | Interstellar and circumstellar matter | |
| DOI | https://doi.org/10.1051/0004-6361/202243332 | |
| Published online | 21 July 2022 | |
Dents in the Veil: protostellar feedback in Orion
1
Kapteyn Astronomical Institute, University of Groningen,
PO Box 800,
9700 AV
Groningen, The Netherlands
e-mail: This email address is being protected from spambots. You need JavaScript enabled to view it.
2
SRON Netherlands Institute for Space Research,
Landleven 12,
9747 AD
Groningen, The Netherlands
3
SOFIA Science Center, USRA, NASA Ames Research Center,
M.S. N232–12,
Moffett Field, CA
94035, USA
4
Leiden Observatory, Leiden University,
PO Box 9513,
2300 RA
Leiden, The Netherlands
5
Department of Astrophysical and Planetary Sciences, University of Colorado,
Boulder, Colorado
80389, USA
6
Instituto de Fisica Fundamental, CSIC,
Calle Serrano 121–123,
28006
Madrid, Spain
Received:
15
February
2022
Accepted:
22
March
2022
Abstract
Context. Interest in stellar feedback has recently increased because new studies suggest that radiative and mechanical feedback from young massive stars significantly regulates the physical and chemical composition of the interstellar medium. Recent SOFIA [C ii] 158 μm observations of the Orion Veil have revealed that the expanding bubble is powered by stellar winds and influenced by previously active molecular outflows of ionizing massive stars.
Aims. We aim to investigate the mechanical feedback on the whole Veil shell by searching for jets and outflows that interact with the Veil shell and by determining the driving mechanisms of these collisions.
Methods. We make use of the [C ii] 158 μm map of the Orion Nebula taken with the upGREAT instrument on board SOFIA. We image the [C ii] emission of more extreme local standard of rest velocities (υLSR) between −3 and −20 km s−1 to pinpoint the high-velocity structures. Using position-velocity (PV) diagrams and high-velocity [C ii] emission, we search for spots of shock-accelerated [C ii]-emitting gas, so called dents. At these positions, we extract [C ii] line profiles to identify velocity components. We also compare the intensity distribution of the [C ii] emission with that of 8 μm PAH and 70 μm warm dust emission to see if there is a trend among these PDR tracers and to understand the origin of the dents.
Results. We identify six dents on the Veil shell, with sizes between 0.3 and 1.35 pc and expansion velocities ranging from 4 to 14 km s−1, relative to the expanding Veil shell. The [C ii] line widths toward the dents vary from 4 to 16 km s−1 indicating that the dents are the result of interaction of the highly turbulent motions (e.g., shocked gas) with the Veil shell. Moreover, dents appear only in the [C ii] PV diagram, not in the 12CO or HI 21 cm diagrams. Furthermore, the intensity distribution of the [C ii] emission of the dents has a tight correlation with that of the 8 and 70 μm as long as the Orion Molecular Cloud or the Veil do not dominate its emission. Also, the observed dents do not have CO counterpart emission. These results indicate that the dents are made up of CO-dark H2 gas. In light of these findings, as well as the momenta of the dents and their dynamical timescales, we propose that the dents are created by the interaction of collimated jets and outflows from protostars in the Orion star-forming cloud with luminosities ranging from 103 to 104 L⊙, which indicates that they are B-type stars, with the surrounding Veil shell. However, it is challenging to pinpoint the driving stars as they may have moved from the original ejection points of the jets and outflows.
Conclusions. We conclude that the dynamics of the expanding Veil shell is influenced not just by the O-type stars in the Trapezium cluster, but also by less massive stars, especially B-type stars, in the Orion Nebula. Mechanical feedback from protostars with a range of masses appears to play an important role in determining the morphology of H II regions and injecting turbulence into the medium.
Key words: stars: massive / ISM: bubbles / ISM: kinematics and dynamics / HII regions / ISM: jets and outflows
© ESO 2022
1 Introduction
Interest in massive stars (with luminosities grater than 103 L⊙, corresponding to a spectral type of B3 or earlier, and stellar masses higher than 8 M⊙; Tan et al. 2014) has increased in the last three decades because they inject considerable energy and momentum to unbind and disperse their natal clouds via stellar winds, powerful outflows, ionizing radiation, and supernova explosions (Krumholz et al. 2014; Bally 2016; Motte et al. 2018). The injection of mass, momentum, and energy, which is called “stellar feedback”, can be seen on various spatial scales (from ~1 to ~100 pc) and dynamical timescales (from 104 to 106 yr). At first glance, supernova explosions are the most energetic feedback process, delivering immense energy (on the order of 1051 erg seen in observations) that can reshape the morphology and composition of star-forming galaxies on large scales (10–100 pc; Thielemann et al. 2011). However, recent studies have revealed that feedback via protostellar outflows is also vital in setting the observed properties, such as the masses of stars (Olivier et al. 2021; Guszejnov et al. 2021).
In contrast to their low-mass companions, massive stars reach their main-sequence luminosity while still embedded and accreting in a natal cloud of gas and dust due to their shorter Kelvin-Helmholtz timescales (Zinnecker & Yorke 2007). Protostars of all masses eject energetic jets and outflows, which removes the angular momentum excess from the accretion process, until they reach the main sequence (Beuther et al. 2002; Sánchez-Monge et al. 2013; Kavak et al. 2021). This results in the entrainment of a significant amount of ambient molecular material. Even after the jets and outflows switch off when the star reaches the zero-age main sequence (ZAMS), relics of previously active molecular outflows, in other words fossil outflows, will continue to expand on their velocity vector and interact with the surrounding environment (Quillen et al. 2005). Furthermore, massive stars tend to form in dense clusters and exhibit a high multiplicity fraction (Motte et al. 2018). Therefore, it is possible to find newly forming massive stars and their outflows in the same cluster (O'Dell et al. 2015) while other massive stars are already on the main sequence and radiate strong UV radiation (as in the Orion Nebula; Bally 2016). From an observational point of view, quantifying the relative contribution of stellar feedback before and after reaching the ZAMS has been challenging for years (Lopez et al. 2011) despite the fact that state-of-the-art simulations are capable of employing stellar feedback modes individually (Walch et al. 2012; Haid et al. 2018; Grudić et al. 2021).
Orion’s Veil (the Veil for short), which is a series of foreground layers of gas and dust (e.g., nine layers identified by Abel et al. 2019) lying in front of the Trapezium stars (O'Dell 2018), is a unique laboratory for studying the relative effects of feedback mechanisms because its proximity allows us to resolve the bubbles in the Orion Molecular Cloud (OMC) spatially and and in Doppler velocity space (O'Dell et al. 2011). The [C ii]-emitting Veil layer is a thin (0.5 pc), neutral, and predominantly atomic shell (Abel et al. 2016; Goicoechea et al. 2020) expanding at a velocity of 13 km s−1 toward us from the OMC-1 core driven by the kinetic energy converted from stellar winds of θ1 Ori C, the most ionizing star in the Orion Nebula (O'Dell 2001; Pabst et al. 2019). Some studies suggest a multilayered structure model for the Veil based on the velocity components characterized through emission and absorption lines (Abel et al. 2016; O'Dell 2018; Abel et al. 2019). The main emission component of the Veil is traced by [C ii] fine-structure transition (2P3/2 → 2P1/2 at 158 μm or 1.9 THz, i.e., ΔE/κB = 91.2 K), which is the main cooling agent of neutral interstellar gas. While there are other tracers of CO-dark H2 gas (e.g., HF J = 1−0; Kavak et al. 2019), [C ii] is by far the brightest as C+ is the dominant carbon-bearing species and the line is readily excited. Velocity-resolved [C ii] line observations are a state-of-the-art technique for determining the driving mechanisms of feedback in massive star-forming regions (Goicoechea et al. 2015; Seo et al. 2019; Pabst et al. 2019, 2020; Schneider et al. 2020; Tiwari et al. 2021; Luisi et al. 2021).
In addition to photoionization radiation from θ1 Ori C, highvelocity structures such as jets and outflows from young stellar objects and Herbig-Haro objects play a role in the dynamics of the Veil on various scales (Henney et al. 2007; Bally et al. 2006; O'Dell et al. 1997). Recently, Kavak et al. (2022) showed that even relics of previously active molecular outflows (i.e., fossil outflows) from θ1 Ori C affect the morphology of the Veil. Blueshifted ejections, which have relatively weak [O iii] emission, impinge on the neutral foreground Veil shell (HH 202, HH 269, HH 203+204; O'Dell 2001) as the Veil itself expands. The collision of such objects with the Veil shell is a plausible explanation for the large temperature gradients (Peimbert et al. 1991). In this work, we investigate high-velocity structures seen in [C ii] observations using position-velocity (PV) diagrams generated in cuts along the Veil and search for an association with shock-accelerated atomic gas. Furthermore, we attempt to investigate the origin of the shock-accelerated gas1 by estimating its momentum and dynamical timescale.
We organize the paper as follows. In Sect. 2 we describe the [C ii], 12CO, and 13CO and mid- and far-IR observations of the Veil. In Sect. 3, we describe our methods for identifying the dents on the Veil and decomposing the observed [C ii] line profiles over the dent position. Section 4 contains an analysis of the momentum and energy of the dents. Finally, we discuss the origin of the dents and suggest possible further studies in Sect. 5.
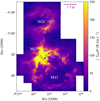 |
Fig. 1 [C ii] 158 μm integrated line intensity map (from υLSR −50 and +50 km s−1) of the OMC obtained with the upGREAT receiver on board SOFIA. The bubbles of NGC 1977, M 42, and M 43 as well as the Trapezium stars and the Orion Bar are indicated. The 1.5 pc length is indicated by the line at the top right. |
2 Observations
2.1 [C ii] observations
The observations were carried out with the Stratospheric Observatory for Infrared Astronomy (SOFIA), an airborne observatory project funded by the US National Aeronautics and Space Administration (NASA) and the German Aerospace Centre (DLR). SOFIA is a Boeing 747-SP jetliner that has been adapted to carry a 2.7-meter-diameter telescope in the back fuselage (Young et al. 2012).
The data were collected with the German REceiver for Astronomy at Terahertz Frequencies (upGREAT) Instrument on board SOFIA (Risacher et al. 2018) for the large program of the C+ SQUAD led by A. G. G. M. Tielens. The spectral and spatial resolution during the observation is about 0.04 km s−1 and 14.1″. The final data were resampled to 0.3 km s−1 to achieve a better signal-to-noise ratio (see Fig. 1). The spatial resolution of the map is smoothed to 16″, which corresponds to ≃0.03 pc at the distance of Orion, 414 pc (Menten et al. 2007). The final rms noise (in Tmb) is 1.14 K in 0.3 km s−1 velocity channels. More information on the observations and data reduction can be found in Pabst et al. (2020) and Higgins et al. (2021).
2.2 Molecular gas observations
We made use of the 12CO J = 2−1 (230.5 GHz) and 13CO J = 2−1 (220.4 GHz) line maps taken with the Institut de Radioastronomie Millimétrique (IRAM) 30 m telescope in the framework of the large program “Dynamic and Radiative Feedback of Massive Stars” (PI: J. R. Goicoechea). In order to facilitate comparison with the velocity-resolved [C ii] map, we smoothed the 12CO (2–1) and 13CO (2–1) data to the angular resolution of the SOFIA [C ii] maps, 16″. The average rms noise level in these maps is 0.16 K in 0.41 km s−1 velocity channels. A more detailed description of the CO observations can be found in Goicoechea et al. (2020).
2.3 Atomic gas observations
We used an HI 21 cm observation of the Veil shell obtained with the Karl G. Jansky Very Large Array in the C and K configurations. The observation has an angular resolution of 7.2″ × 5.7″ and a velocity resolution of 0.77 km s−1. Further details on data reduction and observation can be found in van der Werf et al. (2013).
2.4 Mid-IR observations
Mid-IR observations were taken with the space-borne Spitzer telescope (Werner et al. 2004), which conducted scientific observations between 2003 and 2020 with three focal plane instruments, one of which being the Infrared Array Camera (IRAC; Fazio et al. 2004). IRAC is a four-channel camera that produces 5.2 × 5.2 arcminute images at 3.6, 4.5, 5.8, and 8 μm. We utilized Spitzer 8 μm observations of the Orion Nebula to trace the UV-illuminated surface of the Veil. The full width at half maximum of the point spread function is 1.9″ at 8.0 μm.
2.5 Far-IR photometric observations
The OMC was observed as part of the Gould Belt Survey (André et al. 2010) in parallel mode using the Photoconductor Array Camera and Spectrometer (PACS, Poglitsch et al. 2010) and Spectral and Photo-metric Imaging Receiver (SPIRE, Griffin et al. 2010) instruments on board Herschel. We used only the archival photometric images of the PACS instrument at 70 μm, which trace emission from warm dust grains, for comparison with the [C ii] map over the dents.
3 Identification of dents
The dents can be detected in velocity-resolved channel maps and PV diagrams (Quillen et al. 2005; Stanke et al. 2022). We first identified notable dents in [C ii] PV diagrams along the Orion Veil (Sect. 3.1). We find that the dents emit at a υLSR of −3 to −20 km s−1, which is about −15 to −30 km s−1 blueshifted from the OMC emission (Sect. 3.3). We then integrated the [C ii] emission (green hue in Fig. 3) between these velocities to identify further dents in high-velocity [C ii] channels (Sect. 3.2).
3.1 Position-velocity (PV) diagrams
Because structures in the Veil are hard to find in the integrated map of [C ii], the unbiased way of identifying shock-accelerated material or dents is the PV diagram. We examined [C ii] PV diagrams of the Orion Veil produced with 30″ broad horizontal and vertical slices. The horizontal cuts (east to west) are 60′ long, while the vertical cuts (south to north) are 45′ long because of the non-spherical morphology of the Orion Nebula.
The PV diagrams uncover the complicated structure of the Veil, which is exposed to ionizing radiation from the Trapezium stars (O'Dell et al. 2017). In all PV diagrams, the [C ii] emission at υLSR = +9 km s−1 indicates the background cloud OMC-1 (see the PV diagram of dent 4 in Fig. 2 and of all dents in Appendix C). The main blueshifted expanding structure, moving toward us, is the Veil shell, expanding at 13 km s−1 (Pabst et al. 2019). In addition to these structures, we find “V-shaped” substructures that expand faster than the Veil, similar to what Stanke et al. (2022) recently identified in L1622 using 12CO (3–2) observations from Atacama Pathfinder Experiment (APEX) telescope. Using [C ii] PV diagrams, we identify four dents in the Veil, which are listed with their properties in Table 1. The expansion velocities are measured relative to the blueshifted Veil shell. To this end, we extracted the peak velocity, which is determined via Gaussian fitting of the dent spectrum, of the dent from that of the Veil component. The average size of the dents is about 0.3 pc, which is equal to 2.5′. The size of the dent was calculated along the right ascension axis in the PV diagrams. Since we know the width of each crosscut, the size of the dent in declination was estimated by the number of PV diagrams in which it appears.
Additionally, we examined the PV diagrams of the H I 21 cm and 12CO observations of the Veil shell to see if the dent looks identical to that of [C ii] 158 μm (see also Fig. 2). First of all, we find that the van der Werf et al. (2013)’s HI observation covers four of the dents identified previously in the [C ii] PV diagrams. In Appendix C we provide H I PV diagrams of these dents. Because the H I PV diagrams behave differently, the HI observations cannot be used to trace the dents.
3.2 High-velocity [C ii] emission
As an alternative approach to identifying the interaction of stellar jets and outflows with the Veil, we perused the [C ii] channel maps. Inspection of these maps reveals [C ii] emission between −20 and −3 km s−1. We examined the [C ii] channel maps, which show blueshifted gas with a rather high velocity associated with the Veil. This was accomplished by superimposing the [C ii] emission within this velocity range as a green hue across the [C ii] of emission of the Veil (blue hue) and the OMC-1 background cloud (red hue) in Fig. 3.
This procedure also results in the identification of dents 1–4. In addition, two more locations of high-velocity [C ii] emission become apparent (dents 5 and 6 in Fig. 3). These spots are the brightest gases and the high-velocity from the Trapezium cluster. The behavior of these high-velocity structures does not appear as a dent in the PV diagrams (see Sect. 3.1). An examination of the consecutive PV diagrams that cover dents 5 and 6 shows that there is blueshifted emission that is slightly faster than the Veil and that the velocity of the [C ii]-emitting gas increases toward the peak of these structures (see Figs. C.9 and C.10).
We also note that there is high-velocity [C ii] emission we have not considered in this work, especially in the Huygens region. This region has been the subject of many publications: van der Werf et al. (2013); O'Dell (2001); O'Dell et al. (2009) and Abel et al. (2019). The origin of this emission could be a combination of the radiative and mechanical feedback from the Trapezium cluster and perhaps also from the stars in the Orion-S cloud (O'Dell et al. 2009). We also note that we limit this work to focus on dents 5 and 6, which are detected in highvelocity [C ii] emission, since other green hues, especially in the Huygens region, exhibit very complex behavior and do not allow us to estimate the properties of the dents.
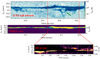 |
Fig. 2 PV diagrams of dent 4. The emission at a υLSR velocity of +9 km s−1 is the OMC, and the weak [C ii] emission of the Veil is at υLSR =−4 km s−1. The dent at 33′ is indicated by a green arrow in the [C ii] 158 μm PV diagram. The 12CO and H i PV diagrams are shown in the middle and lower panels, respectively. H i observation from van der Werf et al. (2013) exists in the area between the two dashed red lines, which is 15′ wide, in the [C ii] and CO observations. Dent 4 is located at 7.5′ in the H i PV diagram. |
Dents identified in this work.
3.3 Line profiles
The [C ii] emission moving toward the dents shows a complex structure in the PV diagrams. To explore the origin of each component, we extracted the [C ii] spectral line profiles across the six dents from the data cube and present them in Fig. between local standard of rest (LSR) velocities of −30 and +30 km s−1. We utilized the size of the dent in arcminutes estimated from the PV diagrams to determine the size of the extraction region. In the direction of the dents, the line profile suggests a multicomponent structure.
We used a multi-Gaussian model to fit the [C ii] spectra and estimate the line parameters. The fit results are listed in Table A.1. In the LSR, all [C ii] spectra exhibit three major components: (i) the OMC at +9 km s−1, (ii) Orion’s Veil at about −2 km s−1, and (iii) the dents at −10 km s−1. Dent 1 is an outlier since it exhibits a double peak at the Veil’s velocity (i.e., black and orange fits) as well as a component at the extreme velocity of −19 km s−1 (see black Gaussian fit in Fig. 4).
Dents 5 and 6 behave slightly differently than the other dents (Figs. C.9 and C.10). The PV diagrams of these dents appear to have a bright head of emission that is not linked with the Veil at first glance (see the PV diagram at the top in Figs. C.9 and C.10). In addition, their brightness is similar to the Veil’s. We checked the spectra of the adjacent places to see if accelerated gas is present at the dent positions. According to the spectra in Fig. C.11, these two dents are expanding somewhat faster than the Veil. In Sect. 4, we provide information regarding the origin of the [C ii] emission at the head of the dents.
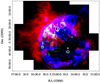 |
Fig. 3 Three-color map of [C ii] emission in the Orion Nebula. Red hues represent the integrated [C ii] emission from the OMC between + 20 and + 3 km s−1. Blue represents the blueshifted [C ii] emission generated by the Veil shell moving between +3 and −3 km s−1. Green represents high-velocity [C ii]-emitting gas at velocities ranging from −3 to −20 km s−1. Gaussian smoothing of radius 35″ is performed to all three colors to reduce the image noise. The white circles indicate the position and size of the dents measured via PV diagrams, and they are also the aperture size for extracting the [C ii] line profiles of the dents. More information is given in Sect. 4. |
4 Analysis
In Sect. 4.1 we summarize the properties of the dents. The momentum of each dent, which is the key parameter used to analyze the driving mechanism, is then estimated (Sect. 4.2) to comprehend the driving process. We compare the [C ii] emission with two crucial photodissociation region (PDR) tracers in Sect. 4.3. Finally, we discuss a possible tracer of dent-like features on the ionization front of H ii regions in Sect. 4.4.
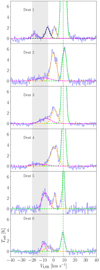 |
Fig. 4 [C ii] 158 μm line profiles using a circular dent-size-width extraction aperture toward the Veil dents listed in Table 1. The vertical dashed green lines indicate the system velocity (+9 km s−1) of Orion. The light green Gaussian fitting line is the OMC, the orange fitting line is the Veil, and the magenta fitting line is the dent. The black line is the component observed at the υLSR of −5 km s−1, a velocity component seen at the south of the Orion Bar PDR in the Huygens region. |
4.1 Characteristics of the dents
In the previous section we identify six dents that have diameters ranging from 0.16 to 0.43 pc. The first four dents in Table 1 stand out in PV diagrams, but the last two dents require confirmation by high-velocity [C ii] emission maps. Four out of the six dents are detected near the Huygens region, which hosts the Trapezium cluster. The other two are in the direction of the extended Orion Nebula (EON; Güdel et al. 2008). None of the dents appear in 12CO PV diagrams (see Appendix C), which suggest a low molecular gas fraction. Morphologically, all dents look like (shark) teeth in PV space, and their υLSR is more negative than that of the Veil shell. The expansion velocity of the dents relative to the Veil ranges from 4 to 14 km s−1. Based on this, we suggest that the dents are made up of CO-dark H2, gas similar to what is seen in the Orion Bar (van der Tak et al. 2012; Goicoechea et al. 2015; Kavak et al. 2019). The formation of H2 remains unclear, but it could be reformed in the shocked gas.
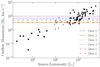 |
Fig. 5 Outflow momentum in M⊙ km s−1 against the luminosity of its driving source in L⊙. Black circles are from Maud et al. (2015), and open triangles from Duarte-Cabral et al. (2013) for high-mass Class−0 objects, and black squares from Dunham et al. (2014) showing the outflows from low-mass stars. Horizontal lines denote the momentum (multiplied by two as outflows are bipolar) of each dent listed in Table 1. Dent 5 and 6 have a lower limit and are indicated by the dashed red lines. |
4.2 Momentum of the dents
The momentum of the dent was estimated to determine the driving mechanism on the assumption that the momentum of outflows from protostars is conserved. In this regard, the mass and velocity of the dent must be estimated. We measured the expansion velocity relative to the Veil shell using the fit results of the [C ii] line profiles. To this end, we subtracted the velocity of the dent from that of the Veil (see Table A.1). The mass parameter is, however, rather uncertain because the Veil shell has density variations of up to a factor of ten and a low NH of ~ 1021 cm−2 (Pabst et al. 2020) toward the line-of-sight. However, it is possible to make an estimation based on the mass calculation reported by Pabst et al. (2019).
The mass accelerated by shocks from the Veil shell outward equals at least the mass entrained in each dent. As the size (2.7 pc) and gas mass (1500 M⊙) of the Veil are known (Pabst et al. 2020), we can roughly calculate the surface mass density of the Veil to calculate the mass parameter assuming a half-sphere geometry with a radius of 2.7 pc for the Veil. The surface density of the Veil is ~30 M⊙ pc−2. We multiplied the area of the dent by the surface density to estimate the shock-accelerated mass, in other words, the mass in the dents. The mass estimation and momentum of the dents are given in Table 1. We also note that dents 5 and 6 are oblique to the surface of the Veil, as shown by a series of PV diagrams (see Figs. C.9 and C.10) in Appendix C. We therefore give a lower limit for the momentum of these two dents in Table 1.
The total momentum of the Veil is 18 000 M⊙ km s−1, and the dents thus carry between 0.5 and 1% of the total momentum injected by the Trapezium stars (Pabst et al. 2020). For comparison, the momentum contained in the protrusion to the northwest is 540 M⊙ km s−1, that is, 3% of the momentum of the Veil shell (Kavak et al. 2022).
The correlation between the jet and outflow momentum and the luminosity of the protostars ejecting the material has been well established (Bontemps et al. 1996; Wu et al. 2004; López -Sepulcre et al. 2010; Duarte-Cabral et al. 2013; Sánchez-Monge et al. 2013; San José-García et al. 2013; Maud et al. 2015; Kavak et al. 2021). These results indicate a relationship across the low-and high-mass regimes between these two quantities (see Fig. 5). In this plot, each dent is individually marked by its momentum. The momentum of the dent implies massive B-type stars with luminosities ranging between 103 and 104 L⊙. Also, because protostellar jets and outflows are typically double-lobed, we doubled the momentum predicted for each dent in our sample before comparing it to the protostellar activity correlation.
Taking the size and the velocity as a guide, we estimate that the formation of the dents would take between (0.5−2.5) × 104 yr. This represents ~l/4 of the expansion timescale of the Veil shell (~2 × 10⁵ yr; Pabst et al. 2019), suggesting that the dents were produced during the expansion of the Veil by forming massive B- and A-type stars, which is consistent with the accreting massive stars reported by Duarte-Cabral et al. (2013). As this young age indicates recent outflow activity, we consider jets and outflows from accreting massive protostars as the most likely driving mechanism.
4.3 Origin of the dents
We looked for correlations between the dent [C ii] emission and tracers of UV versus shock illumination. For this, we made use of [C ii] emission with PDR tracers such as Spitzer 8 μm Polycyclic Aromatic Hydrocarbons (PAH) emission and PACS 70 μm, which traces warm dust (see Fig. 6).
Dent 1 is located just southwest of the bright Orion Bar PDR. The spectrum in the direction of the dent has four components (see Fig. 4), three of which are the dent, the Veil shell, and the background cloud OMC. The fourth component, observed at a υLSR of −5 km s−1, has been interpreted as a broad arc in the shape of an incomplete semicircle near the border of the Huygens region, but the dent at −18 km s−1 is not seen in HI 21 cm observations (van der Werf et al. 2013). The semicircle structure hosts a group of stars, including a B-star (see Fig. B.1). We suggest that dent 1 is accelerated by the jet and outflow of these stars to a υLSR of +20 km s−1. We also suggest that these dents reflect the interaction of jets and outflows with the expanding Veil nebula. The velocity of these jets and outflows must be in excess of the expansion velocity of the Veil itself (13 kms−1; Pabst et al. 2019). We will come back to this hypothesis in Sect. 5.
Luhman et al. (1994) concluded that UV florescence dominates the extended IR H2 (υ > 0) emission toward OMC. Indeed, the extended Ks emission (including the H2 υ = 1−0 S(l) and υ = 2−1 S(l) lines) spatially correlates with the CH+ J = 1−0 emission (Goicoechea et al. 2019), a natural product of reactions between C+ and UV-pumped H2 (υ > 0) (e.g., Agúndez et al. 2010). The EON has been surveyed in the 1−0 S(l) line at 2.12 μm by Stanke et al. (2002). We find that 12 out of 78 H2 features are situated in the direction of the Orion Nebula; however, they are unconnected to the dents because the structures reported by Stanke et al. (2002) are found in dense molecular clouds and dents are associated with the diffuse emission in the Orion Veil. We conclude that shocks that reveal the interaction of protostellar jets with the Veil nebula are difficult to trace directly. The best signature seems to be the velocity shift and broader line widths induced by this shock interaction in the atomic fine-structure cooling lines, but, as argued above, the [C n] emission is dominated by UV-heated gas (see Sect. 4.4).
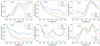 |
Fig. 6 Comparison of normalized [C ii] intensity to that of 8 μm and PACS 70 μm along 0.6 pc long horizontal cuts spanning the dents from east to west. The position of the dent is shown by the vertical dashed blue line. All observations are convolved to 20″ for a proper comparison. |
4.4 Potential shock signature of the dents
If the dents are indeed due to a jet interacting with the Veil, then we would expect to see this region light up in typical shock tracers. Low-velocity interstellar shocks can be J-type or C-type shocks, depending on the strength of the magnetic field and the shock velocity (Draine et al. 1983). The line-of-sight magnetic field is measured to be ~100 μG (Troland et al. 2016). For atomic gas, the critical velocity at which a C-type shock becomes a J-type shock is ~20 km s−1 (Lesaffre et al. 2013). The observed velocities are consistent with a C-type shock in the range of 5 to 15 km s−1. Such a shock would heat a column density of ~1020 cm−2 to ~1000 K (Lesaffre et al. 2013). For a velocity in excess of 20 km s−1, the shock would be a J-type. The gas is then heated to ~ 105 K in the shock front and, in the frame of the shock, would flow at one-fourth of the shock velocity. As the gas cools down, its velocity would decrease. In a J-type shock, cooling through atomic lines becomes more important.
Comparing PDR models (Kaufman et al. 2006; Pound & Wolfire 2008) and shock models, for the atomic cooling lines ([C ii], [O I], [C I], etc.), the shock signature would be overwhelmed by the emission generated by the UV irradiation. The best tracers are low-J H2 lines (Lesaffre et al. 2013), but there too, the UV-heated gas would have to be accounted for. As an example, the H2 0-0 S(1) intensity from a PDR with G0 = 102 is predicted to be 10−5 erg cm−2 s−1 sr−1, which is very comparable to the emission from a 10 km s−1 C-type shock and about ten times the emission from a J-type shock (Lesaffre et al. 2013). High-velocity J-type shocks will lead to emission in optical transitions such as [S ii] λ6731. High-velocity resolution will be required to separate this shock emission from photoionized gas in the EON. Finally, we note that the substantial column density of warm gas in both C- and J-type shocks would enable reactions with substantial energy barriers, and this could lead to detectable amounts of, for example, OH and SH+ (Lesaffre et al. 2013; Godard et al. 2019). As shocks heat the gas to much higher temperatures than PDRs, these species could be used as the signature of the presence of a shock. Similarly, high-spectral-resolution observations of near-IR [Fe ii] and IR [S i] and [Ne ii] lines could be used as shock tracers because these lines originate from levels that cannot be excited in low-density, low-UV field PDRs.
In the dents, the [C ii] 158 μm line widths are always broader than those from the background OMC-1 cloud (see Table A.1). Also, with the exception of dents 5 and 6, the line widths of the dent components are broader than that of the Veil, although the fit uncertainty is sometimes large. There could be a few possibilities to explain the broad line widths: (a) the gas in the dents is warmer than the gas in the Veil, (b) it is much more turbulent, as a result of the passage of the shock, or (c) lines are broad because the [C ii] emission is from hot photoionized gas rather than neutral gas. The observed line width (c) in the dents is
 (1)
(1)
where σturb is the nonthermal velocity dispersion and σth is thermal broadening which change as (kTk/mC+)1/2. This analysis is applicable to optically thin [C ii] emission (i.e., with no opacity broadening). First, we assumed that σth = 0. For the observed line widths (with a median value of 9.36 km s−1 in Table A.1), we required a maximum temperature (Tk) for the gas of 5 × 10⁴ K, which is significantly higher than that of the neutral gas in OMC (Goicoechea et al. 2015). This may imply that [C ii] emission arises from a more turbulent gas in the Veil shell. To compute σturb, we also assumed that the [C ii] gas in the dents is at Tk ~100 K (Pabst et al. 2020). At Tк ~100 K, the speed of sound is ~1 km s−1, and σturb is 9 km s−1 for the line width of 9.36 km s−1 given in Table A.1. This gives us a nonthermal velocity distribution (σturb), which is ∆υFWHM/2.355, of ~4 km s−1. This is greater than the speed of sound at 100 K, indicating that the nonthermal velocity distribution in the dents is a result of turbulent motions such as shocked gas within jets and outflows.
4.5 Collimation factor and opening angle
Assuming that the dents are driven by the jets and outflows of protostars, the collimation factor (f) may also be an indication of the type of star given that outflow collimation decreases from low- to high-mass stars (Bachiller & Tafalla 1999). However, outflows from B- or O-type stars can be well collimated with factors higher than five on a dynamical rimescale shorter than 104 yr (Arce et al. 2007). Moreover, Wu et al. (2004) report that the collimation factor of the outflow from a protostar with bolomet-ric luminosity higher than 103 L⊙ is about two. In our case, the degree of collimation can be estimated depending on the distance (d) between the star and the surface of the Veil shell (see also Fig. B.1 for the assumed geometry). For this purpose, we assumed that the star, which is powering the outflow is located in the core of the Orion Nebula cluster at a distance of 2 pc. The collimation factor varies between 5 and 12, and the opening angle (α) is between 3° and 12° (see Table 1), indicating colli-mated ejections such as molecular jets from massive stars (Arce et al. 2007). If the star-dent distance were substantially smaller than the adopted value, the collimation factor would decrease and the opening angle would increase. For a distance of 0.5 pc, the typical collimation factor and opening angle would be 2° and 40°, respectively. We estimate a timescale of 5.5 × 10⁴ yr (see timescale above) for the formation of for dent , which is one-fourth of the expansion timescale of the Veil shell (Pabst et al. 2019). With this timescale, the star does not need to be directly behind the dent because a massive star with a proper motion of 2 km s−1 can travel about 0.1 pc (~0.8′) away from where its outflows were ejected in 5.5 × 10⁴ yr. Therefore, estimating the driving stars of the dents is challenging.
In addition, the [C ii] spectra around dents 5 and 6 suggest [C ii] emission from accelerated gas (see Fig. C.11). Only these two dents show an increase in [C ii] brightness at their heads. By comparing the intensities in Fig. 6 and previous findings in Sect. 3, we argue that these two dents were also formed by the same mechanisms on the surface of the Veil shell. We, however, are unable to find the same association for all dents in Fig. 6 (see also Table 1) because the [C ii] emission of the Veil and the OMC dominate the [C ii] emission of dents 1–4.
5 Summary
Using SOFIA [C ii] observations, we traced the influence of protostellar feedback by protostars on the Orion Veil. To that aim, we employed PV diagrams and maps of blueshifted [C ii] emission ranging from υLSR = −3 to −20 km s−1. A dent is defined as a shock-accelerated structure that expands outward on the Veil shell. We identify six dents in the Veil shell that are expanding toward us. Their sizes vary between 0.16 and 0.43 pc, and they expand at velocities from 4 to 14 km s−1. Kavak et al. (2022) found that fossil outflows, generated by the Trapezium stars during their protostellar phase, influence the shape of the Veil shell as well. The momentum of the dents indicates newly forming stars with luminosities between 103 and 104 L⊙ (i.e., B-type stars). The dents are therefore a consequence of the collision of active, energetic jets and outflows expelled by massive protostars with the surrounding swept-up shell. The Veil shell is being driven mainly by the stellar wind of θ1 Ori C, the most dominant star in the Trapezium cluster (Abel et al. 2019; Pabst et al. 2019). The Trapezium stars are on the main sequence, and this wind is the result of radiation pressure acting on gas in the stellar photosphere. In contrast, the jets and outflows considered for the dents are driven by accretion onto a protostar. We conclude that, in addition to radiative feedback, both active and fossil outflow processes have a significant impact on the morphology of the Veil shell.
The total momentum in the dents is ~1% of the momentum carried by the Veil shell. Kavak et al. (2022) identified approximately 20 B-type stars in the direction of the Orion Nebula. Half of these 20 stars appear to be located within the Orion Nebula. We discovered six dents in all and may have missed four others. These missing four, we believe, could be located in the direction of the Huygens region, which has a complex morphology. We also speculate that these protostellar jets and outflows may create channels and holes in the Veil that might allow the 106 K plasma to escape the Veil confinement. Any escaping hot plasma will entrain further Veil material and widen the dent aperture. Eventually, the escape of the hot plasma will relieve the pressure of the wind-blown bubble. At that point, the expansion of the Veil will enter a momentum-conserving phase and eventually merge with the material in the Orion-Eridanus superbubble. Supernova explosions in the Orion Ia/Ib associations will sweep up this loose material and transport it to the walls of the super-bubble (Ochsendorf et al. 2015). Further evidence is required to support this hypothesis.
According to van der Werf et al. (2013) and Abel et al. (2019), the Veil shell is ionized by the Trapezium stars and has a multi-layered structure along the line-of-sight. Because shocks in jets and outflows with high velocities in low-density slabs (see also Lehmann et al. 2020) interact with the Veil, they may cause extra [C ii] emission on the Veil surface. This might be attributed to a variety of factors. To begin with, the Veil shell has a low, varying NH toward the line-of-sight as it also shows a density gradient, which might suggest that there is insufficient material on the Veil surface to excite. In addition, the dents are positioned in front of the background OMC-1 cloud, which is likewise exposed to the intense UV radiation of Trapezium stars. This radiation may dominate additional [C ii] emission produced as a result of shock-cloud interaction.
Without velocity-resolved [C ii] observations, it is challenging to unveil the dent-like structure on the Veil shell. Estimating the driving stars of the dents is also difficult as these stars could have moved from the ejection point of their jets and outflows. Unlike CO globules found in the Veil shell (Goicoechea et al. 2020), the dents do not show up in 12CO PV diagrams. This shows that, like the Veil itself, their NH is low because the dents are accelerated from the Veil.
In the future, we plan to search for alternative tracers to follow the dents of the Veil and validate the presence of jets and outflows at their location. For this purpose, long-slit spectra of the 1.644 μm [Fe ii] line, and [S ii] as can for example be observed with the Astrophysical Research Consortium Telescope Imaging Camera (ARCTIC) instrument employed at Apache Point Observatory with high resolution (>10000) might aid in determining the dynamics of the dents. Finally, we conclude that velocity-resolved [C ii] observations of the SOFIA observatory continue to be the best option for discovering feedback mechanisms in massive star-forming regions.
6 Discussion
The Orion Nebula is the closest massive star-forming region, providing an excellent opportunity to study fundamental stellar feedback mechanisms. Recently, SOFIA observations revealed that the Orion Veil shell is primarily driven by the stellar winds of θ1 Ori C, an O6-type star in the main-sequence phase, and that the northern half of the Veil shell was damaged by its now-extinct outflows. While a single massive star, θ1 Ori C, mainly dominates the most energetic mechanisms in Orion, other regions may include a varying number of massive stars as well as newly formed stars of different masses. Other massive star-forming regions are located farther away from Orion, posing problems of spatial resolution and velocity components along the line-of-sight. The size of the dents varies by approximately 0.3 pc, and this type of structure may be resolved in Doppler space in a region five times the distance from the Orion Nebula. We will use velocity-resolved [C ii] line observations to search for dent-like structures in massive star-forming regions to see if they are common in star-forming regions. In this context, the SOFIA FEEDBACK Legacy Program (Schneider et al. 2020) will provide [C ii] line observations of 11 massive star-forming regions at 158 μm.
Acknowledgements
We thank Antoine Gusdorf for useful discussions on the shock models and Paul van der Werf for providing HI 21 cm observation of the Orion Veil. Studies of interstellar dust and gas at Leiden Observatory are supported by a Spinoza award from the Dutch Science agency, NWO. J.R.G. thanks the Spanish MICINN for funding support under grant PID2019-106110GB-I00. This study was based on observations made with the NASA/DLR Stratospheric Observatory for Infrared Astronomy (SOFIA). SOFIA is jointly operated by the Universities Space Research Association Inc. (USRA), under NASA contract NAS2-97001, and the Deutsches SOFIA Institut (DSI), under DLR contract 50 OK 0901 to the University of Stuttgart. upGREAT is a development by the MPI für Radioastronomie and the KOSMA/Universität zu Köln, in cooperation with the DLR Institut für Optische Sensorsysteme. We acknowledge the work, during the C+ upGREAT square degree survey of Orion, of the USRA and NASA staff of the Armstrong Flight Research Center in Palmdale, the Ames Research Center in Mountain View (California), and the Deutsches SOFIA Institut.
Appendix A Gaussian fitting results
Appendix B Massive stars and geometry
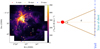 |
Fig. B.1 Massive stars toward Orion and dent geometry. Left: SOFIA [С II] map of Orion with О−, B−, and A−stars found in SIMBAD. The blue-, orange-, and red-filled circles are О, B, and A stars, respectively. White open circles indicate the dents identified in this work. Right: Geometry we used to calculate the collimation factor and opening angle (a). |
Appendix C PV diagram of the dents
This section contains a series of PV diagrams that cover the dents studied in this work. The length of all PV diagrams is 60′. Dents are indicated by a colored arrow.
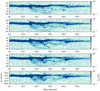 |
Fig. C.1 Five consecutive PV diagrams showing the changes of dent 1. The PV diagrams cover the Veil shell from east to west, spanning 60′ in length and 30″' in width. The declination of the PV diagram changes from the top to the bottom panel. The dent at 25′ is indicated with a green arrow. |
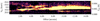 |
Fig. C.2 H121 cm PV diagram of dent 1. In Fig. C.1 the dent indicated by a green arrow is centered on the center of the PV diagram, i.e., at 7.5′ on the x axis. An HI observation exists between the offsets 18′ and 33′ in the [C ii] PV diagram in Fig. C.1. |
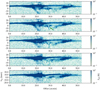 |
Fig. C.3 Five consecutive PV diagrams showing the changes of dent 2. The PV diagrams cover the Veil shell from east to west, spanning 60′ in length and 30″ in width. The declination of the PV diagram changes from the top to the bottom panel. The dent at 27′ is indicated with a green arrow. |
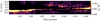 |
Fig. C.4 H I 21 cm PV diagram of dent 2. In Fig. C.3, the dent indicated by a green arrow is centered on the center of the PV diagram, i.e., at 7.5′ on the x axis. H I observation exists between the offsets 20′ and 35′ in the [C ii] PV diagram in Fig. C.3. |
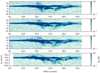 |
Fig. C.5 Four consecutive PV diagrams showing the changes of dent 3. The PV diagrams cover the Veil shell from east to west, spanning 60' in length and 30″ in width. The declination of the PV diagram changes from the top to the bottom panel. The dent at 33′ is indicated with a green arrow. |
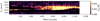 |
Fig. C.6 H121 cm PV diagram of dent 3. In Fig. C.5, the dent indicated by a green arrow is centered on the center of the PV diagram, i.e., at 7.5′ in the x-axis. HI observation exists between the offsets 25′ and 40′ in the [C ii] PV-diagram in Fig. C.5. |
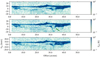 |
Fig. C.7 Three consecutive PV diagrams showing the changes of dent 4. The PV diagrams cover the Veil shell from east to west, spanning 60′ in length and 30″ in width. The declination of the PV diagram changes from the top to the bottom panel. The dent at 34′ is indicated with a green arrow. |
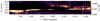 |
Fig. C.8 H I 21 cm PV diagram of dent 4. In Fig. C.7, the dent indicated by a green arrow is centered on the center of the PV diagram, i.e., at 7.5′ on the x axis. H I observation exists between the offsets 25′ and 40′ in the [C ii] PV diagram in Fig. C.7. |
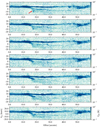 |
Fig. C.9 Seven consecutive PV diagrams showing the changes of dent 5. The PV diagrams cover the Veil shell from east to west, spanning 60′ in length and 30″ in width. The declination of the PV diagram changes from the top to the bottom panel. The dent at 18′ is indicated with a red arrow. |
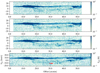 |
Fig. C.10 Four consecutive PV diagrams showing the changes of dent 6. The PV diagrams cover the Veil shell from east to west, spanning 60′ in length and 30″ in width. The declination of the PV diagram changes from the top to the bottom panel. The dent at 33′ is indicated with a red arrow. |
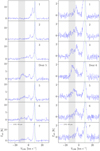 |
Fig. C.11 Horizontally consecutive [C ii] spectra extracted over dents 5 and 6, demonstrating the change in the line profile. |
References
- Abel, N. P., Ferland, G. J., O’Dell, C. R., & Troland, T. H. 2016, ApJ, 819, 136 [NASA ADS] [CrossRef] [Google Scholar]
- Abel, N. P., Ferland, G. J., & O’Dell, C. R. 2019, ApJ, 881, 130 [Google Scholar]
- Agúndez, M., Goicoechea, J. R., Cernicharo, J., Faure, A., & Roueff, E. 2010, ApJ, 713, 662 [Google Scholar]
- André, P., Men’shchikov, A., Bontemps, S., et al. 2010, A&A, 518, L102 [NASA ADS] [CrossRef] [EDP Sciences] [Google Scholar]
- Arce, H. G., Shepherd, D., Gueth, F., et al. 2007, in Protostars and Planets V, eds. B. Reipurth, D. Jewitt, & K. Keil (Tucson: University of Arizona Press), 245 [Google Scholar]
- Bachiller, R., & Tafalla, M. 1999, in NATO Advanced Study Institute (ASI) Series C, The Origin of Stars and Planetary Systems, eds. C. J. Lada, & N. D. Kylafis (Berlin: Springer), 540, 227 [NASA ADS] [CrossRef] [Google Scholar]
- Bally, J. 2016, ARA&A, 54, 491 [Google Scholar]
- Bally, J., Licht, D., Smith, N., & Walawender, J. 2006, AJ, 131, 473 [NASA ADS] [CrossRef] [Google Scholar]
- Beuther, H., Schilke, P., Sridharan, T. K., et al. 2002, A&A, 383, 892 [NASA ADS] [CrossRef] [EDP Sciences] [Google Scholar]
- Bontemps, S., Andre, P., Terebey, S., & Cabrit, S. 1996, A&A, 311, 858 [NASA ADS] [Google Scholar]
- Draine, B. T., Roberge, W. G., & Dalgarno, A. 1983, ApJ, 264, 485 [CrossRef] [Google Scholar]
- Duarte-Cabral, A., Bontemps, S., Motte, F., et al. 2013, A&A, 558, A125 [NASA ADS] [CrossRef] [EDP Sciences] [Google Scholar]
- Dunham, M. M., Arce, H. G., Mardones, D., et al. 2014, ApJ, 783, 29 [NASA ADS] [CrossRef] [Google Scholar]
- Fazio, G. G., Hora, J. L., Allen, L. E., et al. 2004, ApJS, 154, 10 [Google Scholar]
- Godard, B., Pineau des Forêts, G., Lesaffre, P., et al. 2019, A&A, 622, A100 [NASA ADS] [CrossRef] [EDP Sciences] [Google Scholar]
- Goicoechea, J. R., Teyssier, D., Etxaluze, M., et al. 2015, ApJ, 812, 75 [Google Scholar]
- Goicoechea, J. R., Santa-Maria, M. G., Bron, E., et al. 2019, A&A, 622, A91 [NASA ADS] [CrossRef] [EDP Sciences] [Google Scholar]
- Goicoechea, J. R., Pabst, C. H. M., Kabanovic, S., et al. 2020, A&A, 639, A1 [NASA ADS] [CrossRef] [EDP Sciences] [Google Scholar]
- Griffin, M. J., Abergel, A., Abreu, A., et al. 2010, A&A, 518, L3 [EDP Sciences] [Google Scholar]
- Grudic, M. Y., Guszejnov, D., Hopkins, P. F., Offner, S. S. R., & Faucher-Giguère, C.-A. 2021, MNRAS, 506, 2199 [NASA ADS] [CrossRef] [Google Scholar]
- Güdel, M., Briggs, K. R., Montmerle, T., et al. 2008, Science, 319, 309 [Google Scholar]
- Guszejnov, D., Grudic, M. Y., Hopkins, P. F., Offner, S. S. R., & Faucher-Giguère, C.-A. 2021, MNRAS, 502, 3646 [NASA ADS] [CrossRef] [Google Scholar]
- Haid, S., Walch, S., Seifried, D., et al. 2018, MNRAS, 478, 4799 [Google Scholar]
- Henney, W. J., O’Dell, C. R., Zapata, L. A., et al. 2007, AJ, 133, 2192 [NASA ADS] [CrossRef] [Google Scholar]
- Higgins, R., Kabanovic, S., Pabst, C., et al. 2021, A&A, 652, A77 [NASA ADS] [CrossRef] [EDP Sciences] [Google Scholar]
- Kaufman, M. J., Wolfire, M. G., & Hollenbach, D. J. 2006, ApJ, 644, 283 [Google Scholar]
- Kavak, Ü., van der Tak, F. F. S., Tielens, A. G. G. M., & Shipman, R. F. 2019, A&A, 631, A117 [NASA ADS] [CrossRef] [EDP Sciences] [Google Scholar]
- Kavak, Ü., Sánchez-Monge, Á., López-Sepulcre, A., et al. 2021, A&A, 645, A29 [NASA ADS] [CrossRef] [EDP Sciences] [Google Scholar]
- Kavak, Ü., Goicoechea, J. R., Pabst, C. H. M., et al. 2022, A&A, 660, A109 [NASA ADS] [CrossRef] [EDP Sciences] [Google Scholar]
- Krumholz, M. R., Bate, M. R., Arce, H. G., et al. 2014, in Protostars and Planets VI, eds. H. Beuther, R. S. Klessen, C. P. Dullemond, & T. Henning (Tucson: University of Arizona Press), 243 [Google Scholar]
- Lehmann, A., Godard, B., Pineau des Forêts, G., & Falgarone, E. 2020, A&A, 643, A101 [EDP Sciences] [Google Scholar]
- Lesaffre, P., Pineau des Forêts, G., Godard, B., et al. 2013, A&A, 550, A106 [NASA ADS] [CrossRef] [EDP Sciences] [Google Scholar]
- López-Sepulcre, A., Cesaroni, R., & Walmsley, C. M. 2010, A&A, 517, A66 [NASA ADS] [CrossRef] [EDP Sciences] [Google Scholar]
- Lopez, L. A., Krumholz, M. R., Bolatto, A. D., Prochaska, J. X., & Ramirez-Ruiz, E. 2011, ApJ, 731, 91 [Google Scholar]
- Luhman, M. L., Jaffe, D. T., Keller, L. D., & Pak, S. 1994, ApJ, 436, L185 [NASA ADS] [CrossRef] [Google Scholar]
- Luisi, M., Anderson, L. D., Schneider, N., et al. 2021, Sci. Adv., 7, eabe9511 [NASA ADS] [CrossRef] [Google Scholar]
- Maud, L. T., Moore, T. J. T., Lumsden, S. L., et al. 2015, MNRAS, 453, 645 [Google Scholar]
- Menten, K. M., Reid, M. J., Forbrich, J., & Brunthaler, A. 2007, A&A, 474, 515 [NASA ADS] [CrossRef] [EDP Sciences] [Google Scholar]
- Motte, F., Bontemps, S., & Louvet, F. 2018, ARA&A, 56, 41 [NASA ADS] [CrossRef] [Google Scholar]
- Ochsendorf, B. B., Brown, A. G. A., Bally, J., & Tielens, A. G. G. M. 2015, ApJ, 808, 111 [NASA ADS] [CrossRef] [Google Scholar]
- O’Dell, C. R. 2001, ARA&A, 39, 99 [Google Scholar]
- O’Dell, C. R. 2018, MNRAS, 478, 1017 [NASA ADS] [CrossRef] [Google Scholar]
- O’Dell, C. R., Hartigan, P., Bally, J., & Morse, J. A. 1997, AJ, 114, 2016 [CrossRef] [Google Scholar]
- O’Dell, C. R., Henney, W. J., Abel, N. P., Ferland, G. J., & Arthur, S. J. 2009, AJ, 137, 367 [CrossRef] [Google Scholar]
- O’Dell, C. R., Ferland, G. J., Porter, R. L., & van Hoof, P. A. M. 2011, ApJ, 733, 9 [Google Scholar]
- O’Dell, C. R., Ferland, G. J., Henney, W. J., et al. 2015, AJ, 150, 108 [CrossRef] [Google Scholar]
- O’Dell, C. R., Kollatschny, W., & Ferland, G. J. 2017, ApJ, 837, 151 [CrossRef] [Google Scholar]
- Olivier, G. M., Lopez, L. A., Rosen, A. L., et al. 2021, ApJ, 908, 68 [NASA ADS] [CrossRef] [Google Scholar]
- Pabst, C., Higgins, R., Goicoechea, J. R., et al. 2019, Nature, 565, 618 [NASA ADS] [CrossRef] [Google Scholar]
- Pabst, C. H. M., Goicoechea, J. R., Teyssier, D., et al. 2020, A&A, 639, A2 [NASA ADS] [CrossRef] [EDP Sciences] [Google Scholar]
- Peimbert, M., Sarmiento, A., & Fierro, J. 1991, PASP, 103, 815 [NASA ADS] [CrossRef] [Google Scholar]
- Poglitsch, A., Waelkens, C., Geis, N., et al. 2010, A&A, 518, L2 [NASA ADS] [CrossRef] [EDP Sciences] [Google Scholar]
- Pound, M. W., & Wolfire, M. G. 2008, ASP Conf. Ser., 394, 654 [Google Scholar]
- Quillen, A. C., Thorndike, S. L., Cunningham, A., et al. 2005, ApJ, 632, 941 [NASA ADS] [CrossRef] [Google Scholar]
- Risacher, C., Güsten, R., Stutzki, J., et al. 2018, J. Astron. Instrum., 7, 1840014 [NASA ADS] [CrossRef] [Google Scholar]
- San José-García, I., Mottram, J. C., Kristensen, L. E., et al. 2013, A&A, 553, A125 [NASA ADS] [CrossRef] [EDP Sciences] [Google Scholar]
- Sánchez-Monge, Á., López-Sepulcre, A., Cesaroni, R., et al. 2013, A&A, 557, A94 [NASA ADS] [CrossRef] [EDP Sciences] [Google Scholar]
- Schneider, N., Simon, R., Guevara, C., et al. 2020, PASP, 132, 104301 [NASA ADS] [CrossRef] [Google Scholar]
- Seo, Y. M., Goldsmith, P. F., Walker, C. K., et al. 2019, ApJ, 878, 120 [NASA ADS] [CrossRef] [Google Scholar]
- Stanke, T., McCaughrean, M. J., & Zinnecker, H. 2002, A&A, 392, 239 [NASA ADS] [CrossRef] [EDP Sciences] [Google Scholar]
- Stanke, T., Arce, H. G., Bally, J., et al. 2022, A&A, 658, A178 [NASA ADS] [CrossRef] [EDP Sciences] [Google Scholar]
- Tan, J. C., Beltrán, M. T., Caselli, P., et al. 2014, in Protostars and Planets VI, eds. H. Beuther, R. S. Klessen, C. P. Dullemond, & T. Henning (Tucson: University of Arizona Press), 149 [Google Scholar]
- Thielemann, F. K., Hirschi, R., Liebendörfer, M., & Diehl, R. 2011, Astronomy with Radioactivities, Massive Stars and Their Supernovae, eds. R. Diehl, D. H. Hartmann, & N. Prantzos (Berlin: Springer), 812, 153 [NASA ADS] [CrossRef] [Google Scholar]
- Tiwari, M., Karim, R., Pound, M. W., et al. 2021, ApJ, 914, 117 [NASA ADS] [CrossRef] [Google Scholar]
- Troland, T. H., Goss, W. M., Brogan, C. L., Crutcher, R. M., & Roberts, D. A. 2016, ApJ, 825, 2 [NASA ADS] [CrossRef] [Google Scholar]
- van der Tak, F. F. S., Ossenkopf, V., Nagy, Z., et al. 2012, A&A, 537, L10 [NASA ADS] [CrossRef] [EDP Sciences] [Google Scholar]
- van der Werf, P. P., Goss, W. M., & O’Dell, C. R. 2013, ApJ, 762, 101 [NASA ADS] [CrossRef] [Google Scholar]
- Walch, S. K., Whitworth, A. P., Bisbas, T., Wünsch, R., & Hubber, D. 2012, MNRAS, 427, 625 [NASA ADS] [CrossRef] [Google Scholar]
- Werner, M. W., Roellig, T. L., Low, F. J., et al. 2004, ApJS, 154, 1 [NASA ADS] [CrossRef] [Google Scholar]
- Wu, Y., Wei, Y., Zhao, M., et al. 2004, A&A, 426, 503 [NASA ADS] [CrossRef] [EDP Sciences] [Google Scholar]
- Young, E. T., Becklin, E. E., Marcum, P. M., et al. 2012, ApJ, 749, L17 [NASA ADS] [CrossRef] [Google Scholar]
- Zinnecker, H., & Yorke, H. W. 2007, ARA&A, 45, 481 [Google Scholar]
We use the term “dent” for the shock-accelerated gas because the shocks collide with the inner surface of the Veil, resulting in hollow-like structures on the Veil’s surface.
All Tables
All Figures
|
Fig. 1 [C ii] 158 μm integrated line intensity map (from υLSR −50 and +50 km s−1) of the OMC obtained with the upGREAT receiver on board SOFIA. The bubbles of NGC 1977, M 42, and M 43 as well as the Trapezium stars and the Orion Bar are indicated. The 1.5 pc length is indicated by the line at the top right. |
| In the text | |
|
Fig. 2 PV diagrams of dent 4. The emission at a υLSR velocity of +9 km s−1 is the OMC, and the weak [C ii] emission of the Veil is at υLSR =−4 km s−1. The dent at 33′ is indicated by a green arrow in the [C ii] 158 μm PV diagram. The 12CO and H i PV diagrams are shown in the middle and lower panels, respectively. H i observation from van der Werf et al. (2013) exists in the area between the two dashed red lines, which is 15′ wide, in the [C ii] and CO observations. Dent 4 is located at 7.5′ in the H i PV diagram. |
| In the text | |
|
Fig. 3 Three-color map of [C ii] emission in the Orion Nebula. Red hues represent the integrated [C ii] emission from the OMC between + 20 and + 3 km s−1. Blue represents the blueshifted [C ii] emission generated by the Veil shell moving between +3 and −3 km s−1. Green represents high-velocity [C ii]-emitting gas at velocities ranging from −3 to −20 km s−1. Gaussian smoothing of radius 35″ is performed to all three colors to reduce the image noise. The white circles indicate the position and size of the dents measured via PV diagrams, and they are also the aperture size for extracting the [C ii] line profiles of the dents. More information is given in Sect. 4. |
| In the text | |
|
Fig. 4 [C ii] 158 μm line profiles using a circular dent-size-width extraction aperture toward the Veil dents listed in Table 1. The vertical dashed green lines indicate the system velocity (+9 km s−1) of Orion. The light green Gaussian fitting line is the OMC, the orange fitting line is the Veil, and the magenta fitting line is the dent. The black line is the component observed at the υLSR of −5 km s−1, a velocity component seen at the south of the Orion Bar PDR in the Huygens region. |
| In the text | |
|
Fig. 5 Outflow momentum in M⊙ km s−1 against the luminosity of its driving source in L⊙. Black circles are from Maud et al. (2015), and open triangles from Duarte-Cabral et al. (2013) for high-mass Class−0 objects, and black squares from Dunham et al. (2014) showing the outflows from low-mass stars. Horizontal lines denote the momentum (multiplied by two as outflows are bipolar) of each dent listed in Table 1. Dent 5 and 6 have a lower limit and are indicated by the dashed red lines. |
| In the text | |
|
Fig. 6 Comparison of normalized [C ii] intensity to that of 8 μm and PACS 70 μm along 0.6 pc long horizontal cuts spanning the dents from east to west. The position of the dent is shown by the vertical dashed blue line. All observations are convolved to 20″ for a proper comparison. |
| In the text | |
|
Fig. B.1 Massive stars toward Orion and dent geometry. Left: SOFIA [С II] map of Orion with О−, B−, and A−stars found in SIMBAD. The blue-, orange-, and red-filled circles are О, B, and A stars, respectively. White open circles indicate the dents identified in this work. Right: Geometry we used to calculate the collimation factor and opening angle (a). |
| In the text | |
|
Fig. C.1 Five consecutive PV diagrams showing the changes of dent 1. The PV diagrams cover the Veil shell from east to west, spanning 60′ in length and 30″' in width. The declination of the PV diagram changes from the top to the bottom panel. The dent at 25′ is indicated with a green arrow. |
| In the text | |
|
Fig. C.2 H121 cm PV diagram of dent 1. In Fig. C.1 the dent indicated by a green arrow is centered on the center of the PV diagram, i.e., at 7.5′ on the x axis. An HI observation exists between the offsets 18′ and 33′ in the [C ii] PV diagram in Fig. C.1. |
| In the text | |
|
Fig. C.3 Five consecutive PV diagrams showing the changes of dent 2. The PV diagrams cover the Veil shell from east to west, spanning 60′ in length and 30″ in width. The declination of the PV diagram changes from the top to the bottom panel. The dent at 27′ is indicated with a green arrow. |
| In the text | |
|
Fig. C.4 H I 21 cm PV diagram of dent 2. In Fig. C.3, the dent indicated by a green arrow is centered on the center of the PV diagram, i.e., at 7.5′ on the x axis. H I observation exists between the offsets 20′ and 35′ in the [C ii] PV diagram in Fig. C.3. |
| In the text | |
|
Fig. C.5 Four consecutive PV diagrams showing the changes of dent 3. The PV diagrams cover the Veil shell from east to west, spanning 60' in length and 30″ in width. The declination of the PV diagram changes from the top to the bottom panel. The dent at 33′ is indicated with a green arrow. |
| In the text | |
|
Fig. C.6 H121 cm PV diagram of dent 3. In Fig. C.5, the dent indicated by a green arrow is centered on the center of the PV diagram, i.e., at 7.5′ in the x-axis. HI observation exists between the offsets 25′ and 40′ in the [C ii] PV-diagram in Fig. C.5. |
| In the text | |
|
Fig. C.7 Three consecutive PV diagrams showing the changes of dent 4. The PV diagrams cover the Veil shell from east to west, spanning 60′ in length and 30″ in width. The declination of the PV diagram changes from the top to the bottom panel. The dent at 34′ is indicated with a green arrow. |
| In the text | |
|
Fig. C.8 H I 21 cm PV diagram of dent 4. In Fig. C.7, the dent indicated by a green arrow is centered on the center of the PV diagram, i.e., at 7.5′ on the x axis. H I observation exists between the offsets 25′ and 40′ in the [C ii] PV diagram in Fig. C.7. |
| In the text | |
|
Fig. C.9 Seven consecutive PV diagrams showing the changes of dent 5. The PV diagrams cover the Veil shell from east to west, spanning 60′ in length and 30″ in width. The declination of the PV diagram changes from the top to the bottom panel. The dent at 18′ is indicated with a red arrow. |
| In the text | |
|
Fig. C.10 Four consecutive PV diagrams showing the changes of dent 6. The PV diagrams cover the Veil shell from east to west, spanning 60′ in length and 30″ in width. The declination of the PV diagram changes from the top to the bottom panel. The dent at 33′ is indicated with a red arrow. |
| In the text | |
|
Fig. C.11 Horizontally consecutive [C ii] spectra extracted over dents 5 and 6, demonstrating the change in the line profile. |
| In the text | |
Current usage metrics show cumulative count of Article Views (full-text article views including HTML views, PDF and ePub downloads, according to the available data) and Abstracts Views on Vision4Press platform.
Data correspond to usage on the plateform after 2015. The current usage metrics is available 48-96 hours after online publication and is updated daily on week days.
Initial download of the metrics may take a while.