Free Access
Fig. 1
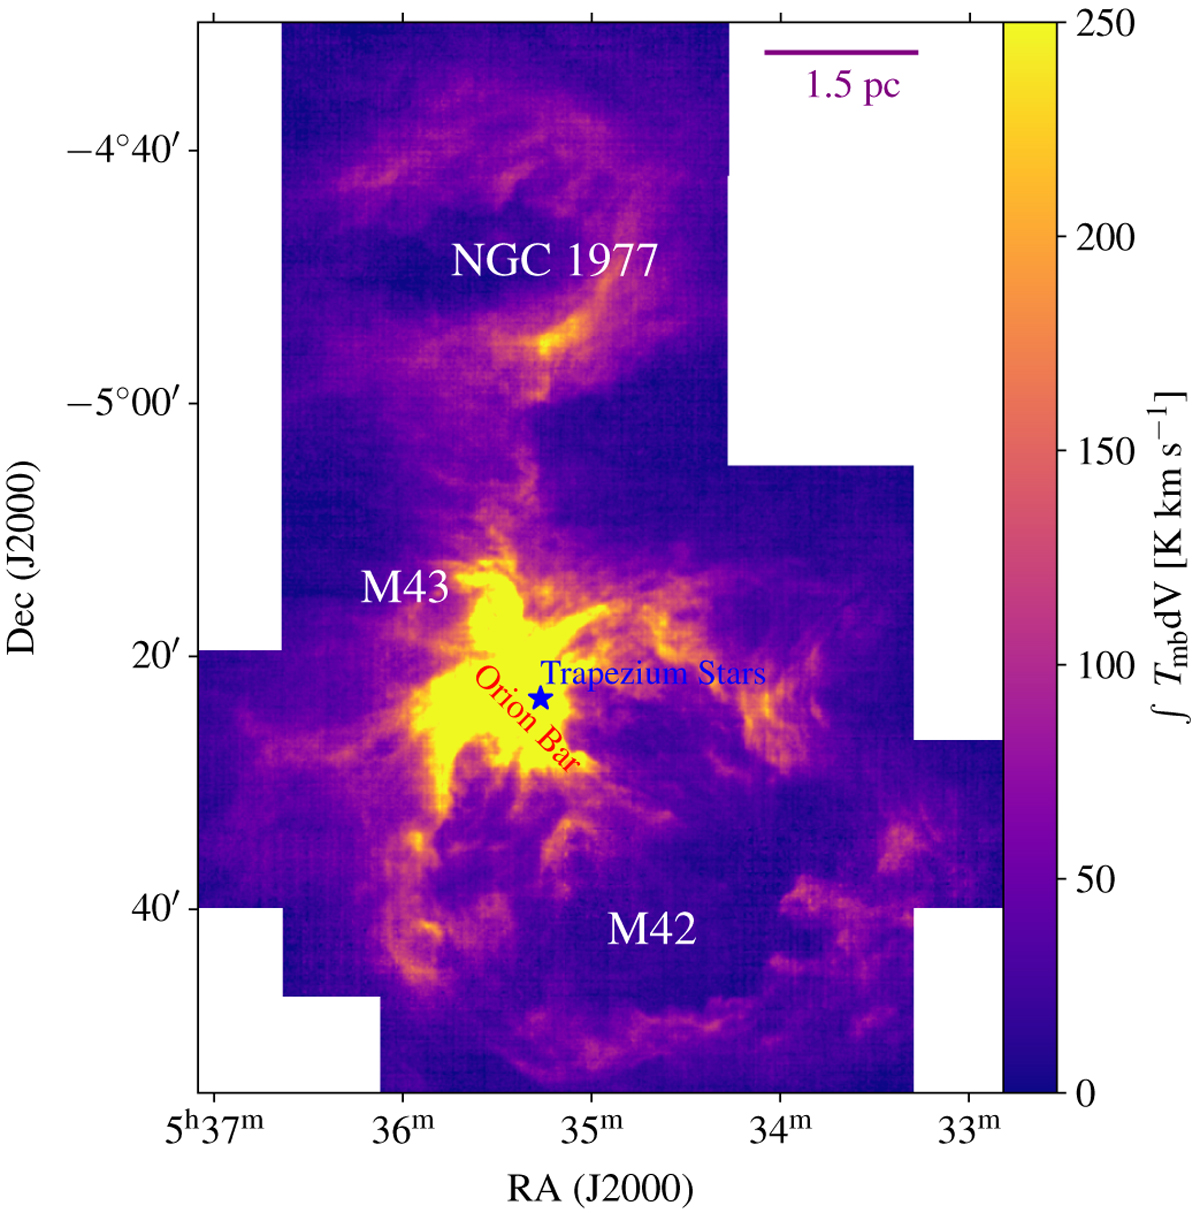
Download original image
[C ii] 158 μm integrated line intensity map (from υLSR −50 and +50 km s−1) of the OMC obtained with the upGREAT receiver on board SOFIA. The bubbles of NGC 1977, M 42, and M 43 as well as the Trapezium stars and the Orion Bar are indicated. The 1.5 pc length is indicated by the line at the top right.
Current usage metrics show cumulative count of Article Views (full-text article views including HTML views, PDF and ePub downloads, according to the available data) and Abstracts Views on Vision4Press platform.
Data correspond to usage on the plateform after 2015. The current usage metrics is available 48-96 hours after online publication and is updated daily on week days.
Initial download of the metrics may take a while.