Fig. 3

Download original image
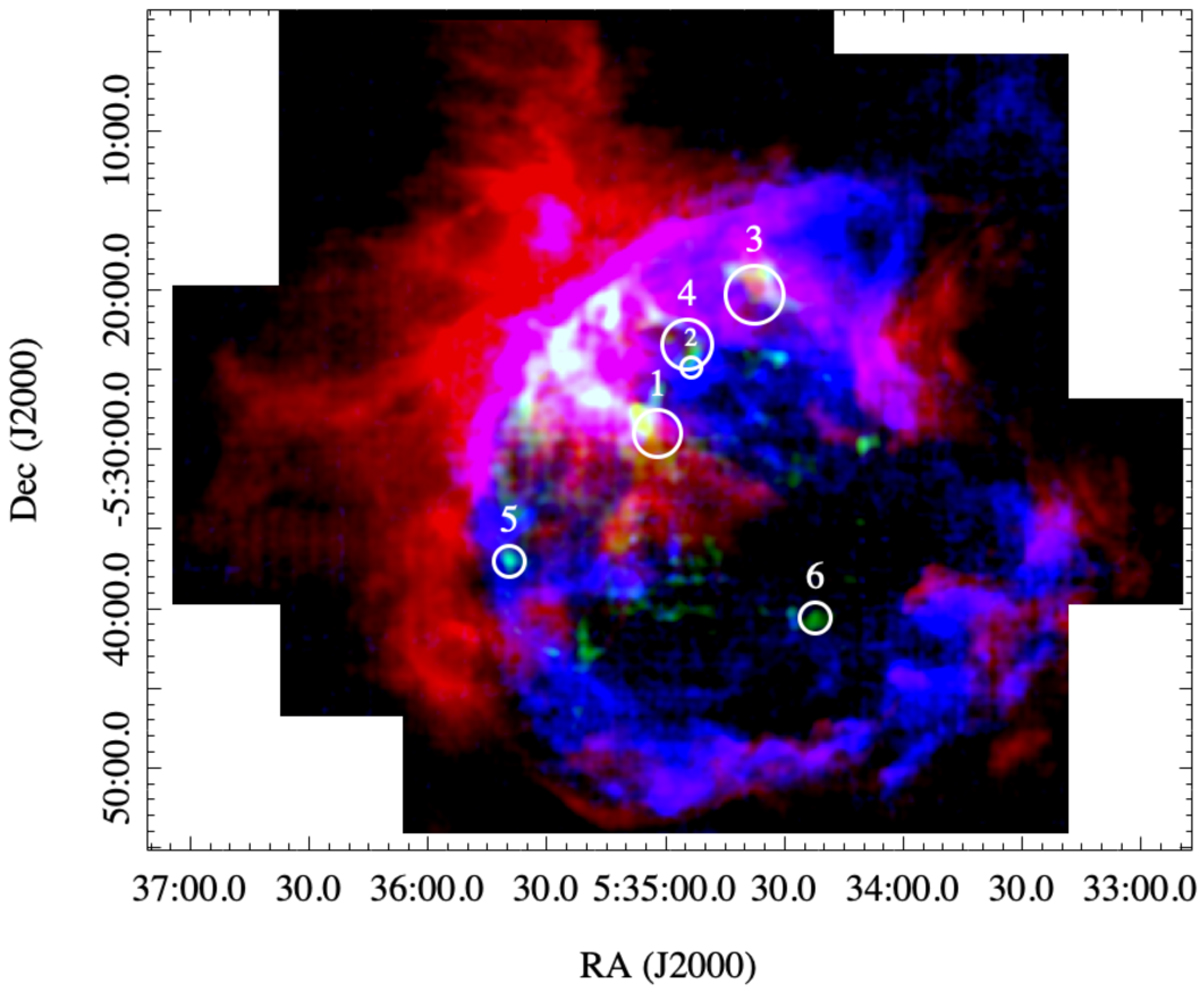
Three-color map of [C ii] emission in the Orion Nebula. Red hues represent the integrated [C ii] emission from the OMC between + 20 and + 3 km s−1. Blue represents the blueshifted [C ii] emission generated by the Veil shell moving between +3 and −3 km s−1. Green represents high-velocity [C ii]-emitting gas at velocities ranging from −3 to −20 km s−1. Gaussian smoothing of radius 35″ is performed to all three colors to reduce the image noise. The white circles indicate the position and size of the dents measured via PV diagrams, and they are also the aperture size for extracting the [C ii] line profiles of the dents. More information is given in Sect. 4.
Current usage metrics show cumulative count of Article Views (full-text article views including HTML views, PDF and ePub downloads, according to the available data) and Abstracts Views on Vision4Press platform.
Data correspond to usage on the plateform after 2015. The current usage metrics is available 48-96 hours after online publication and is updated daily on week days.
Initial download of the metrics may take a while.


