| Issue |
A&A
Volume 647, March 2021
|
|
|---|---|---|
| Article Number | A87 | |
| Number of page(s) | 32 | |
| Section | Interstellar and circumstellar matter | |
| DOI | https://doi.org/10.1051/0004-6361/202039619 | |
| Published online | 12 March 2021 | |
The prebiotic molecular inventory of Serpens SMM1
I. An investigation of the isomers CH3NCO and HOCH2CN
1
Physics Institute, University of Bern,
Sidlerstrasse 5,
3012
Bern, Switzerland
e-mail: ligterink@strw.leidenuniv.nl
2
Leiden Observatory, Leiden University,
PO Box 9513,
2300 RA
Leiden, The Netherlands
3
Laboratoire d’Astrophysique de Bordeaux, Univ. Bordeaux, CNRS, B18N, allée Geoffroy Saint-Hilaire,
33615
Pessac, France
4
Department of Space, Earth and Environment, Chalmers University of Technology,
41296
Gothenburg, Sweden
5
Institute of Astronomy, Faculty of Physics, Astronomy and Informatics, Nicolaus Copernicus University,
Grudziadzka 5,
87-100
Torun, Poland
6
Max-Planck Institut für Extraterrestrische Physik (MPE),
Giessenbachstr. 1,
85748
Garching, Germany
7
Laboratory for Astrophysics, Leiden Observatory, Leiden University,
PO Box 9513,
2300 RA
Leiden, The Netherlands
8
Centre for Star and Planet Formation, Niels Bohr Institute & Natural History Museum of Denmark, University of Copenhagen,
Øster Voldgade 5–7,
1350
Copenhagen K., Denmark
9
Departments of Chemistry and Astronomy, University of Virginia,
Charlottesville,
VA
22904, USA
Received:
8
October
2020
Accepted:
21
December
2020
Aims. Methyl isocyanate (CH3NCO) and glycolonitrile (HOCH2CN) are isomers and prebiotic molecules that are involved in the formation of peptide structures and the nucleobase adenine, respectively. These two species are investigated to study the interstellar chemistry of cyanides (CN) and isocyanates (NCO) and to gain insight into the reservoir of interstellar prebiotic molecules.
Methods. ALMA observations of the intermediate-mass Class 0 protostar Serpens SMM1-a and ALMA-PILS data of the low-mass Class 0 protostar IRAS 16293B are used. Spectra are analysed with the CASSIS line analysis software package in order to identify and characterise molecules.
Results. CH3NCO, HOCH2CN, and various other molecules are detected towards SMM1-a. HOCH2CN is identified in the PILS data towards IRAS 16293B in a spectrum extracted at a half-beam offset position from the peak continuum. CH3NCO and HOCH2CN are equally abundant in SMM1-a at [X]/[CH3OH] of 5.3 × 10⁻⁴ and 6.2 × 10⁻⁴, respectively. A comparison between SMM1-a and IRAS 16293B shows that HOCH2CN and HNCO are more abundant in the former source, but CH3NCO abundances do not differ significantly. Data from other sources are used to show that the [CH3NCO]/[HNCO] ratio is similar in all these sources within ~10%.
Conclusions. The new detections of CH3NCO and HOCH2CN are additional evidence for a large interstellar reservoir of prebiotic molecules that can contribute to the formation of biomolecules on planets. The equal abundances of these molecules in SMM1-a indicate that their formation is driven by kinetic processes instead of thermodynamic equilibrium, which would drive the chemistry to one product. HOCH2CN is found to be much more abundant in SMM1-a than in IRAS 16293B. From the observational data, it is difficult to indicate a formation pathway for HOCH2CN, but the thermal Strecker-like reaction of CN− with H2CO is a possibility. The similar [CH3NCO]/[HNCO] ratios found in the available sample of studied interstellar sources indicate that these two species are either chemically related or their formation is affected by physical conditions in the same way. Both species likely form early during star formation, presumably via ice mantle reactions taking place in the dark cloud or when ice mantles are being heated in the hot core. The relatively high abundances of HOCH2CN and HNCO in SMM1-a may be explained by a prolonged stage of relatively warm ice mantles, where thermal and energetic processing of HCN in the ice results in the efficient formation of both species.
Key words: astrochemistry / astrobiology / ISM: abundances / submillimeter: ISM / ISM: individual objects: Serpens SMM1
© ESO 2021
1 Introduction
Observations of molecules towards star-forming regions provide insight into the kind of species that end up in planet-forming discs. These molecules not only aid planet formation but can also seed newly formed planets with a cocktail of molecules from which largerorganic molecules can be formed. Prebiotic molecules are of particular interest as they are involved in the formation of biomolecules, such as amino acids, nucleobases, proteins, and lipids (Sandford et al. 2020). In the interstellar medium (ISM) and on planets, prebiotic molecules are the building blocks from which biomolecules are made.
In the ISM, several prebiotic molecules have been detected. Examples are formamide (NH2 CHO, Rubin et al. 1971), a precursor to nucleobases and amino acids (Saladino et al. 2012), the simplest sugar-like molecule glycolaldehyde (HOCH2CHO, Hollis et al. 2000; Jørgensen et al. 2012), methylamine (CH3 NH2, Kaifu et al. 1974; Bøgelund et al. 2019) and aminoacetonitrile (NH2 CH2CN, Belloche et al. 2008), building blocks of the amino acid glycine (Holtom et al. 2005; Lee et al. 2009), the peptide building blocks acetamide (CH3 C(O)NH2) and N-methylformamide (CH3 NHCHO, Hollis et al. 2006; Halfen et al. 2011; Belloche et al. 2017, 2019; Ligterink et al. 2020), the chiral molecule propylene oxide (CH3 CHCH2O, McGuire et al. 2016), cyanomethanimine (NHCHCN), which can oligomerise to form adenine (Zaleski et al. 2013; Rivilla et al. 2019), and the nucleobase precursors cyanamide (NH2 CN, Turner et al. 1975; Coutens et al. 2018), hydroxylamine (NH2 OH, Rivilla et al. 2020), and carbamide (also known as urea, NH2 C(O)NH2, Belloche et al. 2019). In recent years, methyl isocyanate (CH3 NCO, Halfen et al. 2015; Cernicharo et al. 2016; Ligterink et al. 2017) has been detected in several interstellar sources, and its isomer glycolonitrile (also known as hydroxy acetonitrile, HOCH2CN, Zeng et al. 2019) is recently identified for the first time in the ISM towards the low-mass protostar IRAS 16293–2422B (hereafter IRAS 16293B). Both of these isomers are prebiotic molecules. CH3 NCO can engage in reactions that form peptide-like structures, while HOCH2CN is known to accelerate the oligomerisation of HCN in liquids and ice under terrestrial conditions, forming the nucleobase adenine (Schwartz & Goverde 1982; Schwartz et al. 1982).
Besides their relevance to prebiotic chemistry, CH3 NCO and HOCH2CN are also interesting molecules for gaining insight into interstellar nitrogen chemistry. While these molecules, being isomers, have the same elemental composition (C2 H3NO), their chemical structures differ significantly (see Fig. 1). Recent quantum chemical calculations of the stability of C2 H3NO isomers in general reveal that CH3NCO is the most stable of these species, followed by HOCH2CN (Fourré et al. 2020). Therefore, observations of this isomer couple provide information on interstellar reactions involving cyanides (-CN) and isocyanates (-NCO), two important nitrogen-bearing chemical groups, as well as the physical conditions that steer or prohibit this chemistry.
Following the first detection of CH3NCO (Halfen et al. 2015; Cernicharo et al. 2016), it was suggested that HNCO was involved in its formation due to their structural similarity and the large HNCO abundances in interstellar gas and ice (in the form of OCN−; Boogert et al. 2015). Various gas-phase and solid-state methylation (the addition of a CH3 functional group to a molecule) reactions of HNCO, the OCN radical, and the OCN− anion have been proposed as possible reaction pathways. Experimental investigations (Ligterink et al. 2017; Maté et al. 2018) and modelling studies (Martín-Doménech et al. 2017; Quénard et al. 2018; Majumdar et al. 2018) indicate solid-state methylation in the ice mantle as the main pathway to form CH3 NCO:
 (1)
(1)
Variations of this pathway, such as the methylation of HNCO or OCN−, may be possible as well, while completely different reactions, such as the hydrogenation of HCN…CO, may also form CH3NCO.
No gas-phase formation pathways are known for glycolonitrile, but solid-state production routes have been studied theoretically (Woon 2001) and experimentally (Danger et al. 2012, 2014). Laboratory work indicates that the thermally activated reaction between a cyanide anion (CN−) and formaldehyde (H2CO) forms HOCH2CN:
![\begin{equation*} [\textrm{XH}^+\textrm{CN}^-] + \textrm{H}_2\textrm{CO} \longrightarrow {\textrm{HOCH}}_2\textrm{CN} + \textrm{X},\end{equation*}](/articles/aa/full_html/2021/03/aa39619-20/aa39619-20-eq2.png) (2)
(2)
where X is a molecule that can act as a base, such as ammonia (NH3) or water (H2 O). This reaction is the solid-state equivalent of the Strecker synthesis, which is a sequence of chemical reactions that produce amino acids. The Strecker-like formation of HOCH2CN is linked to the formation of aminomethanol (HOCH2NH2, Bossa et al. 2009) and aminoacetonitrile (NH2 CH2CN, Danger et al. 2011). The latter of these species is detected in the ISM and known as a possible intermediate in the formation of the amino acid glycine (Belloche et al. 2008). Irradiation of HOCH2CN results in the photoproducts formylcyanide (HC(O)CN) and ketenimine (CH2 CNH). Although not investigated, hydrogenation and oxygen additions of these two species may provide pathways to form HOCH2CN in the ISM. The solid-state radical-radical reactions HO + CH2CN and HOCH2 + CN can also form glycolonitrile, but neither of these reactions has been investigated (Margulès et al. 2017). However, precursor species to these reactions can be present in ice mantles, in particular when methanol (CH3 OH) or acetonitrile (CH3CN) are energetically processed (Allamandola et al. 1988; Hudson & Moore 2004; Bulak et al. 2020).
Methyl isocyanate and glycolonitrile can thus be used as tracers of reactions involving CN and NCO and investigating their interstellar abundances reveals information about the chemical and physical processes that drive these reactions and interstellar nitrogen chemistry as a whole. CH3NCO and HOCH2CN have only been detected simultaneously in the low-mass protostar IRAS 16293B (Ligterink et al. 2017; Martín-Doménech et al. 2017; Zeng et al. 2019), albeit in different observational data sets. Due to this limited sample size, it is difficult to derive correlations or variations in the C2 H3NO isomer chemistry and therefore simultaneous identifications in other sources are required. Here, deep ALMA observations of the intermediate-mass Class 0 protostar Serpens SMM1-a (hereafter SMM1-a) are presented to derive additional constraints on CH3 NCO and HOCH2CN chemistry.
The Serpens star-forming region contains multiple deeply embedded sources, of which SMM1 is the brightest (Casali et al. 1993). The Serpensregion contains multiple outflows and jets, some of which originate from SMM1 (Dionatos et al. 2013; Hull et al. 2016). The chemistry of the SMM1 hot corino, its outflows, and the Serpens core have been characterised in various studies (e.g. White et al. 1995; Hogerheijde et al. 1999; Kristensen et al. 2010; Öberg et al. 2011; Goicoechea et al. 2012; Tychoniec et al. 2019). High-resolution continuum jet observations have shown that SMM1 consists of multiple sources, of which SMM1-a is the main one (Choi 2009; Dionatos et al. 2014; Hull et al. 2017). SMM1-a has SMM1-b as a close neighbour at ~500 au, while two other sources, SMM1-c and -d, are located further away to its north. Recent distance measurements place the Serpens core, and therefore SMM1, at a distance of436.0 ± 10 pc (Ortiz-León et al. 2017), resulting in a luminosity estimate of the entire SMM1 source of ~100 L⊙. SMM1-a is considered to be an intermediate-mass protostar (Hull et al. 2017; Tychoniec et al. 2019).
In this work, the detection and analysis of the isomers HOCH2CN and CH3NCO towards SMM1-a are presented and compared with literature results of IRAS 16293B and those of other sources. In Sect. 2 the observations towards SMM1 and the analysis method are presented. The detections of HOCH2CN, CH3 NCO, and various other molecules are presented in Sect. 3. Section 4 discusses these detections and their likely formation pathways. The conclusions of this work are presented in Sect. 5.
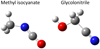 |
Fig. 1 Structures of the C2H3NO isomers methyl isocyanate (CH3NCO, left) and glycolonitrile (HOCH2CN, right). |
Frequency settings of ALMA SMM1 observations.
2 Data and methods
2.1 Observations and spectra of Serpens SMM1
SMM1 was observed on 27-March-2019 during ALMA cycle 6, as part of project #2018.1.00836.S (PI: N.F.W. Ligterink). The region was observed using a total of 42 antennae with baselines spanning 15–332 m in configuration C43-5. The on-source integration time was 50 min, towards the phase centre αJ2000 = 18:29:49.80 δJ2000 = +01:15:20.6. Spectra were recorded in select frequency windows between 217.59 and 235.93 GHz, at resolutions of 488.21 kHz (0.33 km s−2) and 1952.84 kHz (1.25 km s−2) for the continuum window (see Table 1). The data were calibrated and imaged with version 5.4.0-70 of the Common Astronomy Software Applications (CASA). Bandpass and flux calibration was conducted on J2000–1748, while phase calibration was performed on J1851+0035. The flux uncertainty was ≤20%. To reach the desired sensitivity, the measurement sets were cleaned using the Hogbom algorithm (Högbom 1974) and Briggs weighting with a robust parameter of 0.5. This resulted in an angular resolution of 1.′′ 32 × 1.′′04 and an rms noise of 2.6 mJy beam−1 km s−1 in the final spectral data cubes. The primary beam of the observations was 26′′.
Due to the line richness of the source, the following procedure was followed to properly subtract the continuum from the line observations. We imaged all spectral windows without the continuum removed and used the corrected sigma-clipping method of the STATCONT package1 (Sánchez-Monge et al. 2018) to extract a continuum-subtracted line cube. STATCONT can only subtract zeroth-order polynomials, while in this data set non-zeroth-order baselines are visible. Furthermore, continuum subtraction in the uv-plane is more desirable since the deconvolution of the line emission is more robust when it is not subjected to the deconvolution errors of the brighter continuum. Therefore, the STATCONT outputs were used to identify the line-free channels in the spectra and the continuum was subtracted in the uv-plane with the uvcontsub task in CASA. Line-free channels are sparse, but for most spectral windows, at least 20% of the bandwidth was given as input to the uvcontsub task, with the exception of two spectral windows, where only 10% of the bandwidth was line-free. From the resulting datacube, the SMM1-a hot core spectrum was extracted towards the peak continuum position αJ2000 = 18:29:49.793, δJ2000 = +1.15.20.200. From the average continuum flux density (0.41 mJy beam−1), the background temperaturewas determined to be ~5.2 K.
2.2 PILS observations and spectra of IRAS 16293B
In this work,the column density of HOCH2CN is determined independently from the detection presented by Zeng et al. (2019) by analysing data from the Protostellar Interferometric Line Survey (PILS). Other species relevant to this work are also searched for in the PILS data set. The observational details of the PILS survey have been presented in various other publications (e.g. Jørgensen et al. 2016) and here only the most relevant information is presented. In short, the PILS survey makes use of ALMA band 7 observations, covering a frequency range from 329 to 363 GHz at a spatial resolution of 0.′′ 5. To investigate the chemical inventory of IRAS 16293B, spectra are extracted at several positions. These positions are on the peak continuum, a half-beam offset from the peak continuum, and a full-beam offset from the peak continuum. Most PILS analyses of IRAS 16293B make use of the spectrum at the full-beam offset position (e.g. Jørgensen et al. 2016, 2018; Coutens et al. 2016, 2018; Ligterink et al. 2017; Persson et al. 2018; Calcutt et al. 2018). In this work, this is the main position for which molecular ratios with HOCH2CN are determined, but the spectra of other positions are also analysed. The systemic velocity towards these positions is VLSR = 2.7 km s−1 and the line width is approximately ΔV = 1.0 km s−1. Due to the dense dust around IRAS 16293B, the background temperatures (TBG) at these positions are higher than the cosmic microwave background radiation temperature of 2.7 K and couple with the molecular line emission (see Ligterink et al. 2018). At the full-beam offset position TBG = 21 K, while at the half-beam offset position TBG = 52 K.
2.3 Analysis method
The spectra were analysed with the CASSIS2 line analysissoftware. Spectral line lists were obtained from the JPL database for molecular spectroscopy (Pickett et al. 1998), the Cologne Database for Molecular Spectroscopy (CDMS, Müller et al. 2001, 2005), and from the literature. An overview of the spectroscopic line lists used in this work and the laboratory works they are based on is given in Appendix A. Given a spectroscopic line list as input, CASSIS produced synthetic spectra of a molecule based on parameters such as column density (NT), excitation temperature (Tex), peak gas velocity (VLSR), line width at half maximum (ΔV), and source size (θsource). These parameters were given as free parameters to a Monte Carlo Markov chain (MCMC) algorithm and χ2 minimisation routine. This routine found the best-fit of a synthetic spectrum to an observed spectrum over a specified parameter space, thereby determining the best-fit parameters and thus column density and excitation temperature of a molecule. For the analysis, optically thin lines (τ ≪ 1.0) were used. The τ-value was approximated from the by-eye synthetic fit (see below) of the observed rotational lines with the CASSIS software. The molecules were assumed to be in local thermodynamic equilibrium (LTE). Errors on physical parameters take the uncertainty of the fit and the flux uncertainty as input and are calculated from the spread in χ2 values around the minimum toa 3σ confidence level.
In this work, spectral lines of a molecule were identified in the observed spectra and a by-eye synthetic fit of the lines was made. For the by-eye fit, line width and peak velocity were determined from prominent spectral lines of molecules such as HNCO and CH3OH and used as a first approximation for other molecules. An excitation temperature of 200 K was taken as an initial guess and followed by a round of adjusting column density and rotational temperature until a reasonable by-eye fit was found. The by-eye fit results were given as starting parameters for the MCMC χ2 minimisation routine. The χ2 minimisation was performed on lines that are not blended and have minimal contributions from the wings of neighbouring lines. Blending species were identified by checking the line position for other lines of known hot core/corino species with Aij > 1 × 10⁻⁶ and Eup of 0–1000 K. The column density was given as a free parameter over two orders of magnitude centred on the by-eye fit column density and the excitation temperature was a free parameter from 50–350 K. For SMM1-a, ΔV was a free parameter from 1.0–4.0 km s−1, and the source velocity was a free parameter between 6.0–9.0 km s−1. The source size was assumed to be equal to the beam size and taken to be 1.′′ 2, resulting in a beam filling factor of 0.5. A background continuum temperature (Tbg) of 5.2 K was used.
For the analysis of IRAS 16293B, ΔV and VLSR were fixed to 1.0 and 2.7 km s−1, respectively. The source size was assumed to be equal to the beam size at 0.′′ 5, while a background continuum temperatureof Tbg = 21 K was used.
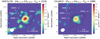 |
Fig. 2 Moment 0 maps of the HOCH2CN 248,17∕16–238,16∕15, Eup = 222 K line and the CH3NCO ν = 0 250,0 –240,0, Eup = 188 K line towards SMM1. Both lines are integrated over eight velocity bins, centred on the peak frequency of each line as determined towards SMM1-a. Positions of protostars in the SMM1 region are indicated and the beam size (1.′′ 32 × 1.′′04) is visualised in the bottom left corner. Dust continuum contours are given by the black dotted line at the levels of 0.02, 0.05, 0.1, 0.2, and 0.5 Jy Beam−1. |
3 Results
3.1 SMM1
In the spectra of SMM1-a, multiple unblended rotational lines of the isomers HOCH2CN and CH3NCO ν = 0 are found. Moment 0 maps (the spatial mapping of the integrated line intensity of a single rotational line) of both species show that most emission originates from SMM1-a (see Fig. 2). The identifiedlines towards SMM1-a are presented in Figs. 3 and 4. For HOCH2CN, this is the second independent interstellar detection of this molecule (the first detection of HOCH2CN is presentedtowards IRAS 16293B by Zeng et al. 2019), while the first detection of CH3NCO towards SMM1-a is part of only a handful of detections of this species towards other interstellar sources.
Several other species are identified in the SMM1-a spectra as well. Rotational lines of acetonitrile (CH3CN ν8 = 1), cyanamide (NH2CN), ethanol (CH3CH2OH), the anti-conformer of ethylene glycol (a-(CH2OH)2), deuterated formaldehyde (D2CO), isocyanic acid (HN12CO and HN13CO), methylformate (CH3OCHO), and methanol (12 CH3OH and CH OH) are detected. Rotational lines of the C2 H3NO isomers methyl fulmiate (CH3CNO) and methyl cyanate (CH3OCN) were not identified in the spectra. The molecules aminoacetonitrile (NH2CH2CN), ketenimine (CH2CNH), and formylcyanide (HC(O)CN) are searched for, but not identified. Spectra are presented in Appendix B and spectroscopic parameters of transitions are provided in Table B.1. Following the procedure detailed in Sect. 2.3, the best-fit parameters of these species are determined. For undetected species, upper limit column densities are determined by assuming Tex = 200 K, which is chosen as a representative excitation temperature from the molecules that are detected. The fit parameters are presented in Table 2. The main isotopologues of CH3OH and HNCO are optically thick and their column densities are therefore determined from minor isotopologues. This is done by multiplying with the local interstellar 12C/13C ratio of 52.5 ± 15.4 (Yan et al. 2019) and 16O/18O ratio of 560 (Wilson 1999).
3.2 IRAS 16293B
Because the chemical inventory of IRAS 16293B is well characterised with results from the PILS survey, this data set is used to search for HOCH2CN and related species to make an unbiased chemical comparison with SMM1-a. While HOCH2CN is identified towards IRAS 16293B by Zeng et al. (2019), this detection cannot be confirmed in the PILS spectrum at the full-beam offset position (the position commonly used for the molecular analysis of IRAS 16293B with PILS data, see Fig. 5). Figure 6 shows the HOCH2CN a-type transitions ( –
– ) at this position covered by the PILS spectral range with a synthetic glycolonitrile spectrum at NT = 1.0 × 1015 cm−2 and Tex = 150 and 300 K. A synthetic spectrum of the previously identified molecules towards IRAS 16293B at the full-beam offset position is added in green. We note that this synthetic spectrum only includes molecules listed in previous publications and does not include HOCH2CN. The molecules and parameters used in this fit are listed in Table C.1. When a rotational spectrum is experimentally measured, a-type transitions are usually the first and most accurately determined transitions. The assignment of these a-type transitions, therefore, is key to claiming an unambiguous identification. However, of the seven a-type transitions covered by the PILS survey, only the 390,39,1–380,38,1 transition at 344 625 MHz is possibly detected, although this feature has a contribution of a HONO and CH2DOH transition (Jørgensen et al. 2016, 2018; Coutens et al. 2019), which also can fully reproduce this line. Appendix C presents all the HOCH2CN transitions at the full-beam offset position that are largely unblended and have Aij ≥ 1 × 10⁻³ s−1. At the full-beam offset position, a large number (~40) of glycolonitrile transitions that are present in the synthetic spectrum are not seen in the observed spectrum. We note that due to the line richness of the source, the baseline subtraction is challenging, and in some cases, it can be oversubtracted. This can explain why certain HOCH2CN lines are not clearly observed as the baseline at these positions dips. Furthermore, some transitions seem to be better reproduced with low excitation temperatures, whereas others require warmer temperatures. This could indicate that two gas components are traced, as also shown by Zeng et al. (2019), but at this position these components are hard to distinguish. Therefore, HOCH2CN can only tentatively be identified towards the full-beam offset position, with a column density of ~1.0 × 1015 cm−2 at Tex = 150 and 300 K.
At the half-beam offset position (see Fig. 5), which is closer to the continuum peak of IRAS 16293B, HOCH2CN can be identified. At this position, at least four a-type transitions are clearly detected, while the three other lines suffer from line blending or absorption features (see Fig. 7). These lines can approximately be fitted with synthetic spectra of NT = 3.0 × 1015 cm−2 for Tex = 150 and 300 K. In Appendix C the remaining HOCH2CN transitions at the half-beam offset position are shown, with the same selection criteria for the full-beam offset position.
In Fig. 5 the moment 0 map of the HOCH2CN 364,32–354,31 transition towards IRAS 16293B is shown. This map shows that HOCH2CN emission towards IRAS 16293B is compact. This explains the non-detection of glycolonitrile towards the full-beam offset position as this position misses most of the HOCH2CN emission. At the same time, this map demonstrates why Zeng et al. (2019) could detect HOCH2CN towards IRAS 16293B: These authors used a larger observational beam of 1.′′ 6 (with an assumed source size of 0.′′5), which covers the entire emitting area.
Because the chemical inventory at the full-beam offset position of the PILS data is characterised best, the tentative detection of HOCH2CN towards this position, with a column density of ~1.0 × 1015 cm−2), is used for further analysis in this paper. However, the identification of HOCH2CN towards the half-beam offset position in combination with the moment 0 map support the detection of HOCH2CN towards IRAS 16923B by Zeng et al. (2019).
The related species CH2CNH, CH(O)CN, and NH2CH2CN are also searched for in the PILS data set, but clear and unblended lines are not identified. For these species upper limit column densities are determined at the full-beam offset position at excitation temperatures of 100 and 300 K. The upper limit column densities and abundances of all species are presented in Table 3.
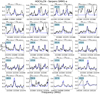 |
Fig. 3 Identified lines of HOCH2CN towards SMM1. The observed spectrum is plotted in black, with the best-fit synthetic spectrum overplotted in blue (NT = (7.4 ± 0.9) × 1014 cm−2, Tex = 260 ± 45 K). The transition is indicated at the top of each panel and the upper state energy is given in the top left of each panel. |
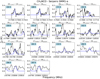 |
Fig. 4 Identified lines of CH3NCO, ν = 0 towards SMM1. The observed spectrum is plotted in black, with the best-fit synthetic spectrum overplotted in blue (NT = (6.4 ± 1.9) × 1014 cm−2, Tex = 240 ± 60 K). The transition is indicated at the top of each panel and the upper state energy is given in the top left of each panel. |
Best-fit parameters for molecules detected towards SMM1-a in a 1.′′2 beam.
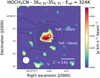 |
Fig. 5 Moment 0 map of the HOCH2CN 364,32 –354,31, Eup = 324 K line towards IRAS 16293B. The line is integrated over eight velocity bins, centred on the peak frequency of the line. The positions of the half-beam and full-beam offset positions around IRAS 16293B are indicated and the beam size (0.′′ 5 × 0.′′5) is visualised in the bottom left corner. Dust continuum contours are given by the black dotted line at the levels of 0.02, 0.05, 0.1, 0.2, and 0.5 Jy Beam−1. |
Best-fit parameters of HOCH2CN and related species towards IRAS 16923B in the PILS data set in a 0.′′5 beam.
4 Discussion
In this work, several molecules are detected towards SMM1-a and analysed. Most notable are the detection of the C2 H3NO isomers CH3NCO (methyl isocyanate) and HOCH2CN (glycolonitrile). For HOCH2CN, this is only its second interstellar detection. CH3NCO has been detected in multiple interstellar sources, but this is the first detection towards SMM1 and therefore also the first detection towards an intermediate-mass source. These new detections serve as additional evidence for a large and diverse reservoir of prebiotic molecules instar- and planet-forming regions, which can contribute to the emergence of biomolecules on planetary bodies. Of the C2 H3NO isomers, CH3NCO is energetically the most favourable, followed by HOCH2CN, which has a higher relative energy of 12.1–18.6 kcal mol−1 (0.5–0.8 eV molecule−1 or 5800–9300 K molecule−1), depending on the level of theory used (Fourré et al. 2020). In a thermodynamic equilibrium,lower energy or more stable products are favoured, and in such a scenario, CH3NCO is expected to be more abundant than HOCH2CN by a factor of at least 1 × 10⁹ (assuming a temperature of 300 K). The fact that CH3NCO and HOCH2CN are found to be equally abundant is, therefore, evidence that the formation of these molecules is instead driven by kinetics.
To better understand the interstellar chemistry of HOCH2CN and CH3NCO, their abundances and those of several other species are compared for SMM1-a, IRAS 16293B, and several other sources for which at least some of these species are detected. For this comparison, it is important to emphasise observational differences. For example, SMM1 (D ≈ 436 pc) is located farther away than IRAS 16293 (D ≈ 141 pc, Dzib et al. 2018) and the beam size used in this work (1.′′2) is larger than that of the PILS survey (0.′′5). Therefore, the chemical inventory of SMM1-a and the involved chemical processes are investigated on a much larger spatial scale of roughly 500 au, compared to about 70 au for IRAS 16293B. The SMM1-a observations can cover a larger range of physical environments (e.g. also the envelope or outflow), and potentially a larger temperature gradient. At the same time, the higher luminosity of SMM1 results in a larger area where hot core conditions are present, thus compensating for the lower spatial resolution. Furthermore, the SMM1-a spectrum is extracted towards the continuum peak, but for IRAS 16293B a full-beam offset position from the continuum peak is used. Therefore, when comparing molecular ratios between the two sources, they may not only be affected by different physical conditions but also due to the way the sources were observed. Observational parameters of SMM1-a, IRAS 16293B, and other sources used for comparisons are listed in Table D.1.
HOCH2CN is thus far only detected in two sources, SMM1-a and IRAS 16293B (Zeng et al. 2019), and therefore a chemical comparison is limited to these two objects. To use molecular ratios that are unbiased by observational parameters, only data of the chemical inventory of IRAS 16293B obtained with PILS survey data at the full-beam offset position is used for the source comparison. This means that the tentative column density of HOCH2CN in IRAS 16293B is used. Figure 8 shows the abundances of molecules detected in this work to CH3OH and HNCO in SMM1-a and IRAS 16293B. For IRAS 16293B, the analysis performed in this work is combined with results from Jørgensen et al. (2016, 2018); Coutens et al. (2016, 2018); Ligterink et al. (2017); Persson et al. (2018); Calcutt et al. (2018). For both the [X]/[CH3OH] and [X]/[HNCO] ratios, all the oxygen-bearing molecules, CH3CN, and NH2CN are found to be more abundant in IRAS 16293B than in SMM1-a. For [X]/[CH3OH] its ratios are generally a factor of a few lower in SMM1-a, while for the [X]/[HNCO] ratios the difference is usually more than a factor of ten.
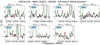 |
Fig. 6 Overview of a-type ( |


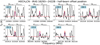 |
Fig. 7 Overview of a-type ( |


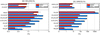 |
Fig. 8 Ratios of [X]/[CH3OH] towards SMM1-a (red) and IRAS 16293B (blue) in decreasing order of SMM1-a abundance. The ‘ ~’ symbol indicates that these HOCH2CN ratios have been determined with the column density of the tentative HOCH2CN detection towards the IRAS 16293B full-beam offset position. For IRAS 16293B, column densities derived towards the full-beam offset position from the following PILS publications are used. a This work, b Ligterink et al. (2017), cCoutens et al. (2016), dJørgensen et al. (2016, 2018), eCalcutt et al. (2018), fPersson et al. (2018), gCoutens et al. (2018). |
4.1 SMM1-a: a HOCH2CN-rich source
While general trends are found in the [X]/[CH3OH] and [X]/[HNCO] ratios displayed in Fig. 8, three molecules deviate from the general trend. The abundance of CH3NCO is found to be approximately equal in both sources, while HOCH2CN and HNCO are more abundant in SMM1-a compared to IRAS 16293B. In particular, for HOCH2CN a large difference is seen in its ratios to CH3OH, which can be more than an order of magnitude different between the two sources.
To gain further insight in how the chemical compositions of SMM1-a and IRAS 16293B differ, the statistical distance of molecular ratios are plotted in Fig. 9. The statistical distance indicates how significant the difference in a molecular ratio between SMM1-a and IRAS 16293B is (see Manigand et al. 2020, and Appendix E). Greater values indicate a greater difference in the molecular ratios between the two sources. A positive value indicates that the ratio of SMM1-a is greater than that of IRAS 16293B and vice versa. Figure 9 highlights that HOCH2CN and HNCO are more abundant in SMM1-a (σ ranging from 3–6) and CH3NCO is moderately more abundant in SMM1-a (σ ≥ 2).
The statistical distance results have several implications. Since the abundances of both HOCH2CN and HNCO are enhanced in SMM1-a, this may indicate a relationship between these two species. For CH3NCO a much lesssignificant enhancement is seen, which can imply that both C2 H3NO isomers form via different chemical reactions or under different physical conditions. However, it is important to stress that an abundance correlation does not always imply a formational link between species (Belloche et al. 2020).
The statistical distances of ratios involving CH3CN, NH2CN, a-(CH2OH), and CH3CH2OH show that there is almost no variation in these molecules between SMM1-a and IRAS 16293B. This is interesting because some of these molecules can form in reactions involving radicals from which HOCH2CN also can be formed, such as CN, CH2OH, and CH2CN. This hints that either HOCH2CN is not formed from these radicals, is not linked to the reaction networks that form the four aforementioned species, or HOCH2CN forms from the same radicals, but under different physical conditions.
Finally, it is interesting to note that ratios of D2CO and CH3OCHO to NH2CN, CH3CH2OH, and a-(CH2OH)2 seem to be a bit more abundant in SMM1-a than in IRAS 16293B. This is particularly significant for the case of D2 CO since H2 CO is involved in the Strecker-like formation of HOCH2CN (see reaction (2)). A higher abundance of H2CO may indicate that the Strecker-like reaction can more efficiently take place. However, care needs to be taken with this interpretation since the D2CO spectral lines in the SMM1-a spectrum are blended and thus there is a large uncertainty on its column density. At the same time, the D/H ratio of H2CO is not known in SMM1-a, which introduces another source of uncertainty. To investigate if there is a correlation between HOCH2CN and H2 CO, both species should be identified towards more sources and H2CO should be observed through its minor 13C and 18O isotopes instead of the deuterated species. For now, however, the Strecker-like synthesis of HOCH2CN in the ISM can neither be confirmed nor ruled out.
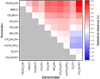 |
Fig. 9 Statistical distance between molecular ratios in SMM1 and IRAS 16293B, given in σ. Larger σ values indicate a larger difference between the two sources for a given ratio. Positive values indicate that a ratio is higher in SMM1-a, while negative values indicate that a ratio is lower in SMM1-a. In particular, all ratios of HOCH2CN are found tobe higher in SMM1-a than in IRAS 16239B. |
4.2 Interstellar formation of CH3NCO
Since its first detection in the ISM, the formation of CH3NCO has been hypothesised to be linked to that of HNCO (see Eq. (1)). To investigate the interstellar chemical relationship between these two species, their gas-phase ratios towards interstellar sources are plotted in Fig. 10. The result of the SMM1-a analysis is complemented by data from the low-mass protostar IRAS 16239B (Ligterink et al. 2017), the quiescent giant molecular cloud G+0.693 (Zeng et al. 2018), the high-mass star-forming region Orion KL (Cernicharo et al. 2016), the high-mass hot molecular core G10.47+0.03 (Gorai et al. 2020), and the galactic centre source Sagittarius B2(N) (Sgr B2(N), Belloche et al. 2013, 2017; Cernicharo et al. 2016). The majority of these sources is categorised as hot cores or corinos. In these sources, thermal desorption of molecules from ice mantles plays an important role to chemically enrich the gas surrounding the protostar, in particular around the desorption temperature of water ice (~100 K). The exception is the source G+0.693, which is a molecular cloud. Molecules observed in the gas of this cloud are assumed to be the result of gas-phase formation reactions or non-thermal desorption from ice mantles of dust grains.
The ratios of CH3NCO and HNCO are generally similar at [CH3NCO] / [HNCO] = ~10% and vary only by a factor of a few, in particular when the lowest and highest ratio are omitted. The lowest ratio, found towards G+0.693, arises in a source with a very different physical structure and can therefore not directly be compared with the hot core and corino sources. The highest ratio is found towards G10.47+0.03, but the analysis of HNCO in this source is likely performed on optically thick HNCO lines and the analysis seems to underestimate the HNCO column density in this source (see Fig. 4 in Gorai et al. 2020). Removing these results from the analysis, a correlation between CH3NCO and HNCO is found, which may indicate a chemical link between CH3NCO and HNCO.Furthermore, this correlation spans a variety of sources of different masses and over four order of magnitude in luminosities. This results in different physical conditions, such as the gas and dust temperatureand radiation fields for each source. Therefore, the lack of source-to-source variation in [CH3NCO]/[HNCO] ratio hints that the abundances of these species are set at an early stage of star formation. Formation of CH3NCO via reaction (1) in the ice mantles of dust grains during the dark cloud stage or while the ice mantles are warmed up in the hot core/corino stage are a plausible scenario.
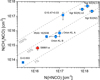 |
Fig. 10 Ratios of [CH3NCO]/[HNCO] ratios towards SMM1-a and various other sources. Column densities from the following publications are used: Belloche et al. (2013, 2017), Cernicharo et al. (2016), Ligterink et al. (2017), Zeng et al. (2018), Gorai et al. (2020), and this work. |
4.3 On the formation of -CN and -NCO molecules
Figure 9 shows that HOCH2CN and HNCO abundances are enhanced in SMM1-a compared to IRAS 16293B. At the same time, CH3NCO is only marginally enhanced and CH3CN and NH2CN abundances show little difference between the two sources. Why the abundances of HOCH2CN and HNCO are enhanced in SMM1-a and those of CH3NCO, CH3CN, and NH2CN are not is not straightforward to explain. However, it is likely that the various -CN and -NCO molecules form in different chemical reactions and physical conditions.
As this work shows, CH3NCO probably forms at an early stage of star formation, as do CH3CN and NH2CN. All three species are suggested to form in radical-radical addition reactions in ice mantles. These reactions take place during the dark cloud stage in cold (~10 K) ice mantles and significantly speed up when the ice mantle temperature increases to ~30 K and radicals become mobile (Garrod et al. 2008; Coutens et al. 2018). Some reactions can compete for the same radical, such as CH3CN and NH2CN, both of which compete for the -CN radical.
The fact that HOCH2CN and HNCO are enhanced in abundance in SMM1-a, can indicate a link between these species. Both molecules can be formed from HCN in ice mantles of interstellar dust grains. HOCH2CN can be formed in the Strecker-like reaction when HCN is converted to CN−. HNCO and the related anion OCN− are formed when HCN:H2O mixtures are processed with energetic UV photons or protons (Gerakines et al. 2004). These reactions are aided by high grain temperatures (≫30 K, but below the water sublimation temperature) for a prolonged time and high fluxes of photons and energetic particles. If these conditions are met in SMM1, they can explain the higher abundances of HOCH2CN and HNCO compared to IRAS 16239B and present a formational link between some -CN and -NCO molecules. However, only circumstantial evidence can be presented for such conditions in SMM1, which is based on the fact that SMM1 hosts multiple protostellar sources and outflows, which can warm and irradiate the cloud (e.g. Choi 2009; Dionatos et al. 2014; Hull et al. 2017; Tychoniec et al. 2019).
To gain further insight into the reactions that form -CN and -NCO molecules, unbiased observations of these species towards a multitude of sources spanning different physical conditions are needed. Not only the isomers HOCH2CN and CH3NCO should be targeted for these observations, but also species like CH3CN, HNCO, NH2CN, C2 H3CN, and C2 H5CN. Laboratory, theoretical and modelling efforts should be focused on understanding the formation of these species. In particular, the formation of HOCH2CN via pathways other than the thermal Strecker-like synthesis needs to be studied and a better understanding of the formation of CH3CN is required.
5 Conclusions
This publication presents the simultaneous detection of the C2 H3NO isomers methyl isocyanate (CH3NCO) and glycolonitrile (HOCH2CN). Both species are identified towards the intermediate-mass Class 0 protostar Serpens SMM1-a. This is only the second interstellar detection of glycolonitrile, while for methyl isocyanate it is the first detection towards an intermediate-mass protostar. Additionally, CH3OH, HNCO, CH3OCHO, CH3CH2OH, a-(CH2OH)2, D2 CO, and NH2CN are detected. CH2CNH, CH(O)CN, and NH2CH2CN, molecules that are related to HOCH2CN formation and destruction, are searched for but not identified. Data from the PILS survey towards IRAS 16293B are analysed in search for HOCH2CN and this molecule is identified in a spectrum extracted at a half-beam offset position from the continuum peak of IRAS 16239B. The molecules CH2CNH, CH(O)CN, and NH2CH2CN are not identified towards this source.
The detection of CH3NCO and HOCH2CN towards SMM1-a is additional evidence of a large interstellar reservoir of prebiotic molecules. Delivery of these molecules to planetary surfaces may contribute to the formation of biomolecules on these objects. The column densities and abundances of CH3NCO (NT = 6.4 × 1014 cm−2 and [CH3NCO]/[CH3OH] = 5.3 × 10⁻⁴) and HOCH2CN (NT = 7.4 × 1014 cm−2 and [HOCH2CN]/ [CH3OH] = 6.2 × 10⁻⁴) are found to be equal within their error bars. Since HOCH2CN is the least energetically favourable of the two isomers, thermodynamics predicts that CH3NCO should be more abundant. The equal ratio between both molecules is therefore evidence that the formation of these molecules is driven by kinetics.
The comparison of molecular ratios between SMM1-a and IRAS 16293B show that HOCH2CN and HNCO are significantly more abundant in the former source. The molecular ratios of HOCH2CN hint that the formation of this molecule does not heavily depend on solid-state radical-radical addition reactions, such as HOCH2 + CN and HO + CH2CN. Formation via the thermal Strecker-like reaction [X+ CN−] + H2CO in ice mantles cannot be confirmed nor ruled out based on the current data but may be a prominent formation pathway.
To investigate the possibility that CH3NCO formation is related to HNCO, the ratios of these molecules in SMM1-a and other sources are analysed. These ratios are found to be uniform throughout all sources at [CH3NCO]/[HNCO] = ~10%. This indicates that there is a chemical link between both species, but also that its ratios is already set at an early stage of star formation. Presumably CH3NCO forms via the radical-radical reaction CH3 + NCO in ice mantles during the dark cloud stage.
It is difficult to establish a chemical link between -CN and -NCO molecules. Some may be related, such as HOCH2CN and HNCO, which can both form from HCN at elevated (≫30 K) grain temperatures and in relatively high radiation fields. Continued observational, laboratory, and theoretical studies of -CN and -NCO molecules are required to gain further insight into their formation and links in their chemistry.
Acknowledgements
We thank E.G. Bøgelund, S.F. Wampfler, M.N. Drozdovskaya, B. Kulterer, and B.A. McGuire for helpful discussions on the observations, spectroscopy, and the chemistry of the C2 H3NO isomers. The authors acknowledge assistance from Allegro, the European ALMA Regional Center node in the Netherlands. We thank the anonymous referee for their thorough review of this manuscript and helpful comments. This paper makes use of the following ALMA data: ADS/JAO.ALMA#2018.1.00836.S and ADS/JAO.ALMA#2013.1.00278.S. ALMA is a partnership of ESO (representing its member states), NSF (USA) and NINS (Japan), together with NRC (Canada), MOST and ASIAA (Taiwan), and KASI (Republic of Korea), in cooperation with the Republic of Chile. The Joint ALMA Observatory is operated by ESO, AUI/NRAO and NAOJ. NFWL is supported by the Swiss National Science Foundation (SNSF) Ambizione grant 193453. J.K.J. is supported by the European Research Council (ERC) under the European Union’s Horizon 2020 research and innovation programme through ERC Consolidator Grant “S4F” (grant agreement No 646908). A.C. acknowledges financial support from the Agence Nationale de la Recherche (grant ANR-19-ERC7-0001-01).
Appendix A Spectroscopic data
In this paper, the CDMS and JPL spectroscopic databases are the primary sources of molecular line lists. In the following table, an overview of the analysed molecules, their identifier and catalogue, and the most important publications in the literature on which these entries are based are given.
Spectroscopic line lists.
Appendix B Supporting information for the SMM1-a analysis
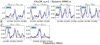 |
Fig. B.1 Identified lines of CH3CN ν8 = 1 towards SMM1. The observed spectrum is plotted in black, with the best-fit synthetic spectrum overplotted in blue (NT = (1.3 ± 0.3) × 1015 cm−2, Tex = 190 ± 25 K). The transition is indicated at the top of each panel and the upper state energy is given in the top left of each panel. |
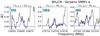 |
Fig. B.2 Identified lines of NH2CN towards SMM1. The observed spectrum is plotted in black, with the best-fit synthetic spectrum overplotted in blue (NT = (5.1 ± 1.3) × 1013 cm−2, Tex = 190 ± 40 K). The transition is indicated at the top of each panel and the upper state energy is given in the top left of each panel. |
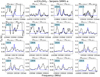 |
Fig. B.3 Identified lines of a-(CH2OH)2 towards SMM1. The observed spectrum is plotted in black, with the best-fit synthetic spectrum overplotted in blue (NT = (1.7 ± 0.5) × 1015 cm−2, Tex = 195 ± 70 K). The transition is indicated at the top of each panel and the upper state energy is given in the top left of each panel. |
Spectral information of molecules detected towards SMM1-a.
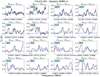 |
Fig. B.4 Identified lines of CH3CH2OH towards SMM1. The observed spectrum is plotted in black, with the best-fit synthetic spectrum overplotted in blue (NT = (4.1 ± 0.9) × 1015 cm−2, Tex = 210 ± 25 K). The transition is indicated at the top of each panel and the upper state energy is given in the top left of each panel. |
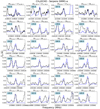 |
Fig. B.5 Identified lines of CH3OCHO towards SMM1. The observed spectrum is plotted in black, with the best-fit synthetic spectrum overplotted in blue (NT = (7.4 ± 0.7) × 1015 cm−2, Tex = 215 ± 20 K). The transition is indicated at the top of each panel and the upper state energy is given in the top left of each panel. |
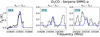 |
Fig. B.6 Identified lines of D2CO towards SMM1. The observed spectrum is plotted in black, with the best-fit synthetic spectrum overplotted in blue (NT = (5.4 ± 0.5) × 1014 cm−2, Tex = [200] K). The transition is indicated at the top of each panel and the upper state energy is given in the top left of each panel. |
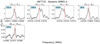 |
Fig. B.7 Identified lines of HN12CO towards SMM1. The observed spectrum is plotted in black and the line position is indicated by the red dotted line. Because these lines are optically thick, no synthetic fit is given. The transition is indicated at the top of each panel and the upper state energy is given in the top left of each panel. |
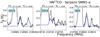 |
Fig. B.8 Identified lines of HN13CO towards SMM1. The observed spectrum is plotted in black, with the best-fit synthetic spectrum overplotted in blue (NT = (1.9 ± 0.3) × 1014 cm−2, Tex = 190 ± 30 K). The transition is indicated at the top of each panel and the upper state energy is given in the top left of each panel. |
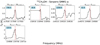 |
Fig. B.9 Identified lines of 12CH3OH towards SMM1. The observed spectrum is plotted in black and the line position is indicated by the red dotted line. Because these lines are optically thick, no synthetic fit is given. The transition is indicated at the top of each panel and the upper state energy is given in the top left of each panel. |
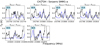 |
Fig. B.10 Identified lines of CH |

Appendix C Analysis of PILS data
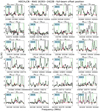 |
Fig. C.1 Spectral lines of HOCH2CN in the PILS spectrum towards IRAS 16293B at the full-beam offset position. The observed spectrum is plotted in black, with synthetic spectra overplotted (NT = [1.0 × 10¹⁵] cm−2, Tex = 150, blue, and 300 K, red). The synthetic spectrum of the entire molecular inventory determined with PILS data towards this position is plotted in green. All covered transitions with Aij ≥ 1.0 × 10⁻³ s−1 that are not blended are shown. The transition is indicated at the top of each panel and the upper state energy is given in the top left of each panel. HOCH2CN is not detected in the full-beam offset position spectrum towards IRAS 16293B. |
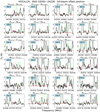 |
Fig. C.1 continued. |
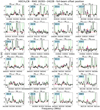 |
Fig. C.1 continued. |
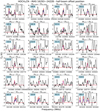 |
Fig. C.2 Spectral lines of HOCH2CN in the PILS spectrum towards IRAS 16293B at the half-beam offset position. The observed spectrum is plotted in black, with synthetic spectra overplotted (NT = [3.0 × 10¹⁵] cm−2, Tex = 150, blue, and 300 K, red). All covered transitions with Aij ≥ 1.0 × 10⁻³ s−1 that are not blended are shown. The transition is indicated at the top of each panel and the upper state energy is given in the top left of each panel. HOCH2CN is detected in the half-beam offset position spectrum towards IRAS 16293B. |
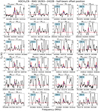 |
Fig. C.2 continued. |
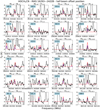 |
Fig. C.2 continued. |
Molecules and parameters used for the IRAS 16293B synthetic spectrum.
HOCH2CN lines in the PILS data towards IRAS 16293B.
Appendix D Source parameters
Physical parameters of interstellar sources used for abundance comparison.
Appendix E Statistical distance
The statistical distance of molecular ratios between SMM1-a and IRAS 16293B is calculated according to the following equation:
 (E.1)
(E.1)
where Nx and Ny are the column densities of two different molecules and σ is the uncertainty on the column density ratio  . The value ofSX/Y is given in σ and indicates the significance of the difference, with greater values implying that there is a more significant difference between the two sources. In this equation, positive values indicate that
  is more abundant in SMM1-a than in IRAS 16293B, while negative values indicate the opposite.
References
- Allamandola, L., Sandford, S., & Valero, G. 1988, Icarus, 76, 225 [NASA ADS] [CrossRef] [Google Scholar]
- Belloche, A., Menten, K., Comito, C., et al. 2008, A&A, 482, 179 [NASA ADS] [CrossRef] [EDP Sciences] [Google Scholar]
- Belloche, A., Müller, H. S., Menten, K. M., Schilke, P., & Comito, C. 2013, A&A, 559, A47 [NASA ADS] [CrossRef] [EDP Sciences] [Google Scholar]
- Belloche, A., Meshcheryakov, A. A., Garrod, R. T., et al. 2017, A&A, 601, A49 [NASA ADS] [CrossRef] [EDP Sciences] [Google Scholar]
- Belloche, A., Garrod, R. T., Müller, H. S. P., et al. 2019, A&A, 628, A10 [NASA ADS] [CrossRef] [EDP Sciences] [Google Scholar]
- Belloche, A., Maury, A., Maret, S., et al. 2020, A&A, 635, A198 [CrossRef] [EDP Sciences] [Google Scholar]
- Bocquet, R., Demaison, J., Cosléou, J., et al. 1999, J. Mol. Spectr., 195, 345 [NASA ADS] [CrossRef] [Google Scholar]
- Bøgelund, E. G., McGuire, B. A., Hogerheijde, M. R., van Dishoeck, E. F., & Ligterink, N. F. W. 2019, A&A, 624, A82 [EDP Sciences] [Google Scholar]
- Boogert, A. A., Gerakines, P. A., & Whittet, D. C. 2015, ARA&A, 53, 541 [Google Scholar]
- Bossa, J., Theule, P., Duvernay, F., & Chiavassa, T. 2009, ApJ, 707, 1524 [NASA ADS] [CrossRef] [Google Scholar]
- Bulak, M., Paardekooper, D., Fedoseev, G., & Linnartz, H. 2020, A&A, 636, A32 [EDP Sciences] [Google Scholar]
- Calcutt, H., Jørgensen, J. K., Müller, H., et al. 2018, A&A, 616, A90 [NASA ADS] [CrossRef] [EDP Sciences] [Google Scholar]
- Casali, M., Eiroa, C., & Duncan, W. 1993, A&A, 275, 195 [Google Scholar]
- Cernicharo, J., Kisiel, Z., Tercero, B., et al. 2016, A&A, 587, L4 [NASA ADS] [CrossRef] [EDP Sciences] [Google Scholar]
- Choi, M. 2009, ApJ, 705, 1730 [NASA ADS] [CrossRef] [Google Scholar]
- Christen, D., & Müller, H. S. 2003, Phys. Chem. Chem. Phys., 5, 3600 [CrossRef] [Google Scholar]
- Christen, D., Coudert, L., Suenram, R. D., & Lovas, F. J. 1995, J. Mol. Spectr., 172, 57 [NASA ADS] [CrossRef] [Google Scholar]
- Coutens,A., Jørgensen, J. K., Van der Wiel, M. H. D., et al. 2016, A&A, 590, L6 [NASA ADS] [CrossRef] [EDP Sciences] [Google Scholar]
- Coutens, A., Willis, E., Garrod, R., et al. 2018, A&A, 612, A107 [NASA ADS] [CrossRef] [EDP Sciences] [Google Scholar]
- Coutens, A., Ligterink, N. F. W., Loison, J.-C., et al. 2019, A&A, 623, L13 [NASA ADS] [CrossRef] [EDP Sciences] [Google Scholar]
- Danger, G., Borget, F., Chomat, M., et al. 2011, A&A, 535, A47 [NASA ADS] [CrossRef] [EDP Sciences] [Google Scholar]
- Danger, G., Duvernay, F., Theulé, P., Borget, F., & Chiavassa, T. 2012, ApJ, 756, 11 [NASA ADS] [CrossRef] [Google Scholar]
- Danger, G., Rimola, A., Mrad, N. A., et al. 2014, Phys. Chem. Chem. Phys., 16, 3360 [CrossRef] [Google Scholar]
- Dionatos, O., Jørgensen, J. K., Green, J. D., et al. 2013, A&A, 558, A88 [NASA ADS] [CrossRef] [EDP Sciences] [Google Scholar]
- Dionatos, O., Jørgensen, J. K., Teixeira, P., Güdel, M., & Bergin, E. 2014, A&A, 563, A28 [NASA ADS] [CrossRef] [EDP Sciences] [Google Scholar]
- Dzib, S., Ortiz-León, G., Hernández-Gómez, A., et al. 2018, A&A, 614, A20 [NASA ADS] [CrossRef] [EDP Sciences] [Google Scholar]
- Fisher, J., Paciga, G., Xu, L.-H., et al. 2007, J. Mol. Spectr., 245, 7 [NASA ADS] [CrossRef] [Google Scholar]
- Fourré, I., Matz, O., Ellinger, Y., & Guillemin, J. 2020, A&A, 639, A16 [EDP Sciences] [Google Scholar]
- Garrod, R. T., Weaver, S. L. W., & Herbst, E. 2008, ApJ, 682, 283 [Google Scholar]
- Gerakines, P., Moore, M., & Hudson, R. 2004, Icarus, 170, 202 [NASA ADS] [CrossRef] [Google Scholar]
- Goicoechea, J. R., Cernicharo, J., Karska, A., et al. 2012, A&A, 548, A77 [NASA ADS] [CrossRef] [EDP Sciences] [Google Scholar]
- Gorai, P., Bhat, B., Sil, M., et al. 2020, ApJ, 895, 86 [Google Scholar]
- Halfen, D. T., Ilyushin, V., & Ziurys, L. M. 2011, ApJ, 743, 60 [NASA ADS] [CrossRef] [Google Scholar]
- Halfen, D., Ilyushin, V. V., & Ziurys, L. M. 2015, ApJ, 812, L5 [NASA ADS] [CrossRef] [EDP Sciences] [Google Scholar]
- Hocking, W., Gerry, M., & Winnewisser, G. 1975, Can. J. Phys., 53, 1869 [NASA ADS] [CrossRef] [Google Scholar]
- Högbom, J. A. 1974, A&AS, 15, 417 [Google Scholar]
- Hogerheijde, M. R., Van Dishoeck, E. F., Salverda, J. M., & Blake, G. A. 1999, ApJ, 513, 350 [NASA ADS] [CrossRef] [PubMed] [Google Scholar]
- Hollis, J. M., Lovas, F. J., & Jewell, P. R. 2000, ApJ, 540, L107 [NASA ADS] [CrossRef] [Google Scholar]
- Hollis, J. M., Lovas, F. J., Remijan, A. J., et al. 2006, ApJ, 643, L25 [Google Scholar]
- Holtom, P. D., Bennett, C. J., Osamura, Y., Mason, N. J., & Kaiser, R. I. 2005, ApJ, 626, 940 [NASA ADS] [CrossRef] [Google Scholar]
- Hudson, R., & Moore, M. 2004, Icarus, 172, 466 [NASA ADS] [CrossRef] [Google Scholar]
- Hull, C. L., Girart, J. M., Kristensen, L. E., et al. 2016, ApJ, 823, L27 [NASA ADS] [CrossRef] [Google Scholar]
- Hull, C. L., Girart, J. M., Tychoniec, Ł., et al. 2017, ApJ, 847, 92 [NASA ADS] [CrossRef] [Google Scholar]
- Ilyushin, V., Kryvda, A., & Alekseev, E. 2009, J. Mol. Spectr., 255, 32 [NASA ADS] [CrossRef] [Google Scholar]
- Jacobsen, S., Jørgensen, J., Van der Wiel, M., et al. 2018, A&A, 612, A72 [NASA ADS] [CrossRef] [EDP Sciences] [Google Scholar]
- Jørgensen, J. K., Favre, C., Bisschop, S. E., et al. 2012, ApJ, 757, L4 [NASA ADS] [CrossRef] [Google Scholar]
- Jørgensen, J. K., Van der Wiel, M. H. D., Coutens, A., et al. 2016, A&A, 595, A117 [NASA ADS] [CrossRef] [EDP Sciences] [Google Scholar]
- Jørgensen, J., Müller, H., Calcutt, H., et al. 2018, A&A, 620, A170 [NASA ADS] [CrossRef] [EDP Sciences] [Google Scholar]
- Kaifu, N., Morimoto, M., Nagane, K., et al. 1974, ApJ, 191, L135 [NASA ADS] [CrossRef] [Google Scholar]
- Koivusaari, M., Horneman, V., & Anttila, R. 1992, J. Mol. Spectr., 152, 377 [NASA ADS] [CrossRef] [Google Scholar]
- Kristensen, L., Van Dishoeck, E., Van Kempen, T., et al. 2010, A&A, 516, A57 [NASA ADS] [CrossRef] [EDP Sciences] [Google Scholar]
- Kukolich, S. G., Nelson, A., & Yamanashi, B. 1971, J. Am. Chem. Soc., 93, 6769 [CrossRef] [Google Scholar]
- Lapinov, A., Golubiatnikov, G. Y., Markov, V., & Guarnieri, A. 2007, Astron. Lett., 33, 121 [NASA ADS] [CrossRef] [Google Scholar]
- Lee, C.-W., Kim, J.-K., Moon, E.-S., Minh, Y. C., & Kang, H. 2009, ApJ, 697, 428 [NASA ADS] [CrossRef] [Google Scholar]
- Ligterink, N., Coutens, A., Kofman, V., et al. 2017, MNRAS, 469, 2219 [NASA ADS] [CrossRef] [Google Scholar]
- Ligterink, N. F. W., Calcutt, H., Coutens, A., et al. 2018, A&A, 619, A28 [NASA ADS] [CrossRef] [EDP Sciences] [Google Scholar]
- Ligterink, N. F., El-Abd, S. J., Brogan, C. L., et al. 2020, ApJ, 901, 37 [Google Scholar]
- Majumdar, L., Loison, J.-C., Ruaud, M., et al. 2018, MNRAS, 473, L59 [Google Scholar]
- Manigand, S., Jørgensen, J., Calcutt, H., et al. 2020, A&A, 635, A48 [NASA ADS] [CrossRef] [EDP Sciences] [Google Scholar]
- Margulès, L., McGuire, B., Senent, M. L., et al. 2017, A&A, 601, A50 [CrossRef] [EDP Sciences] [Google Scholar]
- Martín-Doménech, R., Rivilla, V., Jiménez-Serra, I., et al. 2017, MNRAS, 469, 2230 [NASA ADS] [CrossRef] [Google Scholar]
- Maté, B., Molpeceres, G., Tanarro, I., et al. 2018, ApJ, 861, 61 [CrossRef] [Google Scholar]
- McGuire, B. A., Carroll, P. B., Loomis, R. A., et al. 2016, Science, 352, 1449 [NASA ADS] [CrossRef] [Google Scholar]
- Müller, H. S., Thorwirth, S., Roth, D., & Winnewisser, G. 2001, A&A, 370, L49 [NASA ADS] [CrossRef] [EDP Sciences] [Google Scholar]
- Müller, H. S., Schlöder, F., Stutzki, J., & Winnewisser, G. 2005, J. Mol. Struct., 742, 215 [NASA ADS] [CrossRef] [Google Scholar]
- Müller, H. S., Brown, L. R., Drouin, B. J., et al. 2015, J. Mol. Spectr., 312, 22 [NASA ADS] [CrossRef] [Google Scholar]
- Müller, H. S., Belloche, A., Xu, L.-H., et al. 2016, A&A, 587, A92 [NASA ADS] [CrossRef] [EDP Sciences] [Google Scholar]
- Niedenhoff, M., Yamada, K., Belov, S., & Winnewisser, G. 1995, J. Mol. Spectr., 174, 151 [NASA ADS] [CrossRef] [Google Scholar]
- Öberg, K. I., Van der Marel, N., Kristensen, L. E., & Van Dishoeck, E. F. 2011, ApJ, 740, 14 [NASA ADS] [CrossRef] [Google Scholar]
- Ortiz-León, G. N., Dzib, S. A., Kounkel, M. A., et al. 2017, ApJ, 834, 143 [Google Scholar]
- Pearson, J. C., Brauer, C. S., & Drouin, B. J. 2008, J. Mol. Spectr., 251, 394 [NASA ADS] [CrossRef] [Google Scholar]
- Persson, M. V., Jørgensen, J. K., Müller, H., et al. 2018, A&A, 610, A54 [NASA ADS] [CrossRef] [EDP Sciences] [Google Scholar]
- Pickett, H., Poynter, R., Cohen, E., et al. 1998, J. Quant. Spectr. Rad. Transf., 60, 883 [NASA ADS] [CrossRef] [Google Scholar]
- Quénard, D., Jiménez-Serra, I., Viti, S., Holdship, J., & Coutens, A. 2018, MNRAS, 474, 2796 [NASA ADS] [CrossRef] [Google Scholar]
- Read, W. G., Cohen, E. A., & Pickett, H. M. 1986, J. Mol. Spectr., 115, 316 [Google Scholar]
- Rivilla, V., Martín-Pintado, J., Jiménez-Serra, I., et al. 2019, MNRAS, 483, L114 [NASA ADS] [CrossRef] [Google Scholar]
- Rivilla, V. M., Martín-Pintado, J., Jiménez-Serra, I., et al. 2020, ApJ, 899, L28 [CrossRef] [Google Scholar]
- Rubin, R. H., Swenson, G. W., J., Benson, R. C., Tigelaar, H. L., & Flygare, W. H. 1971, ApJ, 169, L39 [NASA ADS] [CrossRef] [Google Scholar]
- Saladino, R., Crestini, C., Pino, S., Costanzo, G., & Di Mauro, E. 2012, Phys. Life Rev., 9, 84 [NASA ADS] [CrossRef] [Google Scholar]
- Sánchez-Monge, Á., Schilke, P., Ginsburg, A., Cesaroni, R., & Schmiedeke, A. 2018, A&A, 609, A101 [NASA ADS] [CrossRef] [EDP Sciences] [Google Scholar]
- Sandford, S. A., Nuevo, M., Bera, P. P., & Lee, T. J. 2020, Chemical Reviews [Google Scholar]
- Schwartz, A. W., & Goverde, M. 1982, J. Mol. Evol., 18, 351 [Google Scholar]
- Schwartz, A. W., Joosten, H., & Voet, A. 1982, Biosystems, 15, 191 [Google Scholar]
- Turner, B. E., Liszt, H. S., Kaifu, N., & Kisliakov, A. G. 1975, ApJ, 201, L149 [Google Scholar]
- Tychoniec, Ł., Hull, C. L. H., Kristensen, L. E., et al. 2019, A&A, 632, A101 [NASA ADS] [CrossRef] [EDP Sciences] [Google Scholar]
- White, G. J., Casali, M. M., & Eiroa, C. 1995, A&A, 298, 594 [NASA ADS] [Google Scholar]
- Wilson, T. 1999, Rep. Prog. Phys., 62, 143 [Google Scholar]
- Woon, D. E. 2001, Icarus, 149, 277 [NASA ADS] [CrossRef] [Google Scholar]
- Xu, L.-H., Fisher, J., Lees, R., et al. 2008, J. Mol. Spectr., 251, 305 [NASA ADS] [CrossRef] [Google Scholar]
- Yan, Y., Zhang, J., Henkel, C., et al. 2019, ApJ, 877, 154 [NASA ADS] [CrossRef] [Google Scholar]
- Zakharenko, O., Motiyenko, R. A., Margulès, L., & Huet, T. R. 2015, J. Mol. Spectr., 317, 41 [Google Scholar]
- Zaleski, D. P., Seifert, N. A., Steber, A. L., et al. 2013, ApJ, 765, L10 [Google Scholar]
- Zeng, S., Jiménez-Serra, I., Rivilla, V., et al. 2018, MNRAS, 478, 2962 [NASA ADS] [CrossRef] [Google Scholar]
- Zeng, S., Quénard, D., Jiménez-Serra, I., et al. 2019, MNRAS, 484, L43 [Google Scholar]
CASSIS has been developed by IRAP-UPS/CNRS (http://cassis.irap.omp.eu).
All Tables
Best-fit parameters of HOCH2CN and related species towards IRAS 16923B in the PILS data set in a 0.′′5 beam.
All Figures
|
Fig. 1 Structures of the C2H3NO isomers methyl isocyanate (CH3NCO, left) and glycolonitrile (HOCH2CN, right). |
| In the text | |
|
Fig. 2 Moment 0 maps of the HOCH2CN 248,17∕16–238,16∕15, Eup = 222 K line and the CH3NCO ν = 0 250,0 –240,0, Eup = 188 K line towards SMM1. Both lines are integrated over eight velocity bins, centred on the peak frequency of each line as determined towards SMM1-a. Positions of protostars in the SMM1 region are indicated and the beam size (1.′′ 32 × 1.′′04) is visualised in the bottom left corner. Dust continuum contours are given by the black dotted line at the levels of 0.02, 0.05, 0.1, 0.2, and 0.5 Jy Beam−1. |
| In the text | |
|
Fig. 3 Identified lines of HOCH2CN towards SMM1. The observed spectrum is plotted in black, with the best-fit synthetic spectrum overplotted in blue (NT = (7.4 ± 0.9) × 1014 cm−2, Tex = 260 ± 45 K). The transition is indicated at the top of each panel and the upper state energy is given in the top left of each panel. |
| In the text | |
|
Fig. 4 Identified lines of CH3NCO, ν = 0 towards SMM1. The observed spectrum is plotted in black, with the best-fit synthetic spectrum overplotted in blue (NT = (6.4 ± 1.9) × 1014 cm−2, Tex = 240 ± 60 K). The transition is indicated at the top of each panel and the upper state energy is given in the top left of each panel. |
| In the text | |
|
Fig. 5 Moment 0 map of the HOCH2CN 364,32 –354,31, Eup = 324 K line towards IRAS 16293B. The line is integrated over eight velocity bins, centred on the peak frequency of the line. The positions of the half-beam and full-beam offset positions around IRAS 16293B are indicated and the beam size (0.′′ 5 × 0.′′5) is visualised in the bottom left corner. Dust continuum contours are given by the black dotted line at the levels of 0.02, 0.05, 0.1, 0.2, and 0.5 Jy Beam−1. |
| In the text | |
|
Fig. 6 Overview of a-type ( |
| In the text | |
|
Fig. 7 Overview of a-type ( |
| In the text | |
|
Fig. 8 Ratios of [X]/[CH3OH] towards SMM1-a (red) and IRAS 16293B (blue) in decreasing order of SMM1-a abundance. The ‘ ~’ symbol indicates that these HOCH2CN ratios have been determined with the column density of the tentative HOCH2CN detection towards the IRAS 16293B full-beam offset position. For IRAS 16293B, column densities derived towards the full-beam offset position from the following PILS publications are used. a This work, b Ligterink et al. (2017), cCoutens et al. (2016), dJørgensen et al. (2016, 2018), eCalcutt et al. (2018), fPersson et al. (2018), gCoutens et al. (2018). |
| In the text | |
|
Fig. 9 Statistical distance between molecular ratios in SMM1 and IRAS 16293B, given in σ. Larger σ values indicate a larger difference between the two sources for a given ratio. Positive values indicate that a ratio is higher in SMM1-a, while negative values indicate that a ratio is lower in SMM1-a. In particular, all ratios of HOCH2CN are found tobe higher in SMM1-a than in IRAS 16239B. |
| In the text | |
|
Fig. 10 Ratios of [CH3NCO]/[HNCO] ratios towards SMM1-a and various other sources. Column densities from the following publications are used: Belloche et al. (2013, 2017), Cernicharo et al. (2016), Ligterink et al. (2017), Zeng et al. (2018), Gorai et al. (2020), and this work. |
| In the text | |
|
Fig. B.1 Identified lines of CH3CN ν8 = 1 towards SMM1. The observed spectrum is plotted in black, with the best-fit synthetic spectrum overplotted in blue (NT = (1.3 ± 0.3) × 1015 cm−2, Tex = 190 ± 25 K). The transition is indicated at the top of each panel and the upper state energy is given in the top left of each panel. |
| In the text | |
|
Fig. B.2 Identified lines of NH2CN towards SMM1. The observed spectrum is plotted in black, with the best-fit synthetic spectrum overplotted in blue (NT = (5.1 ± 1.3) × 1013 cm−2, Tex = 190 ± 40 K). The transition is indicated at the top of each panel and the upper state energy is given in the top left of each panel. |
| In the text | |
|
Fig. B.3 Identified lines of a-(CH2OH)2 towards SMM1. The observed spectrum is plotted in black, with the best-fit synthetic spectrum overplotted in blue (NT = (1.7 ± 0.5) × 1015 cm−2, Tex = 195 ± 70 K). The transition is indicated at the top of each panel and the upper state energy is given in the top left of each panel. |
| In the text | |
|
Fig. B.4 Identified lines of CH3CH2OH towards SMM1. The observed spectrum is plotted in black, with the best-fit synthetic spectrum overplotted in blue (NT = (4.1 ± 0.9) × 1015 cm−2, Tex = 210 ± 25 K). The transition is indicated at the top of each panel and the upper state energy is given in the top left of each panel. |
| In the text | |
|
Fig. B.5 Identified lines of CH3OCHO towards SMM1. The observed spectrum is plotted in black, with the best-fit synthetic spectrum overplotted in blue (NT = (7.4 ± 0.7) × 1015 cm−2, Tex = 215 ± 20 K). The transition is indicated at the top of each panel and the upper state energy is given in the top left of each panel. |
| In the text | |
|
Fig. B.6 Identified lines of D2CO towards SMM1. The observed spectrum is plotted in black, with the best-fit synthetic spectrum overplotted in blue (NT = (5.4 ± 0.5) × 1014 cm−2, Tex = [200] K). The transition is indicated at the top of each panel and the upper state energy is given in the top left of each panel. |
| In the text | |
|
Fig. B.7 Identified lines of HN12CO towards SMM1. The observed spectrum is plotted in black and the line position is indicated by the red dotted line. Because these lines are optically thick, no synthetic fit is given. The transition is indicated at the top of each panel and the upper state energy is given in the top left of each panel. |
| In the text | |
|
Fig. B.8 Identified lines of HN13CO towards SMM1. The observed spectrum is plotted in black, with the best-fit synthetic spectrum overplotted in blue (NT = (1.9 ± 0.3) × 1014 cm−2, Tex = 190 ± 30 K). The transition is indicated at the top of each panel and the upper state energy is given in the top left of each panel. |
| In the text | |
|
Fig. B.9 Identified lines of 12CH3OH towards SMM1. The observed spectrum is plotted in black and the line position is indicated by the red dotted line. Because these lines are optically thick, no synthetic fit is given. The transition is indicated at the top of each panel and the upper state energy is given in the top left of each panel. |
| In the text | |
|
Fig. B.10 Identified lines of CH |
| In the text | |
|
Fig. C.1 Spectral lines of HOCH2CN in the PILS spectrum towards IRAS 16293B at the full-beam offset position. The observed spectrum is plotted in black, with synthetic spectra overplotted (NT = [1.0 × 10¹⁵] cm−2, Tex = 150, blue, and 300 K, red). The synthetic spectrum of the entire molecular inventory determined with PILS data towards this position is plotted in green. All covered transitions with Aij ≥ 1.0 × 10⁻³ s−1 that are not blended are shown. The transition is indicated at the top of each panel and the upper state energy is given in the top left of each panel. HOCH2CN is not detected in the full-beam offset position spectrum towards IRAS 16293B. |
| In the text | |
|
Fig. C.1 continued. |
| In the text | |
|
Fig. C.1 continued. |
| In the text | |
|
Fig. C.2 Spectral lines of HOCH2CN in the PILS spectrum towards IRAS 16293B at the half-beam offset position. The observed spectrum is plotted in black, with synthetic spectra overplotted (NT = [3.0 × 10¹⁵] cm−2, Tex = 150, blue, and 300 K, red). All covered transitions with Aij ≥ 1.0 × 10⁻³ s−1 that are not blended are shown. The transition is indicated at the top of each panel and the upper state energy is given in the top left of each panel. HOCH2CN is detected in the half-beam offset position spectrum towards IRAS 16293B. |
| In the text | |
|
Fig. C.2 continued. |
| In the text | |
|
Fig. C.2 continued. |
| In the text | |
Current usage metrics show cumulative count of Article Views (full-text article views including HTML views, PDF and ePub downloads, according to the available data) and Abstracts Views on Vision4Press platform.
Data correspond to usage on the plateform after 2015. The current usage metrics is available 48-96 hours after online publication and is updated daily on week days.
Initial download of the metrics may take a while.