Fig. C.2
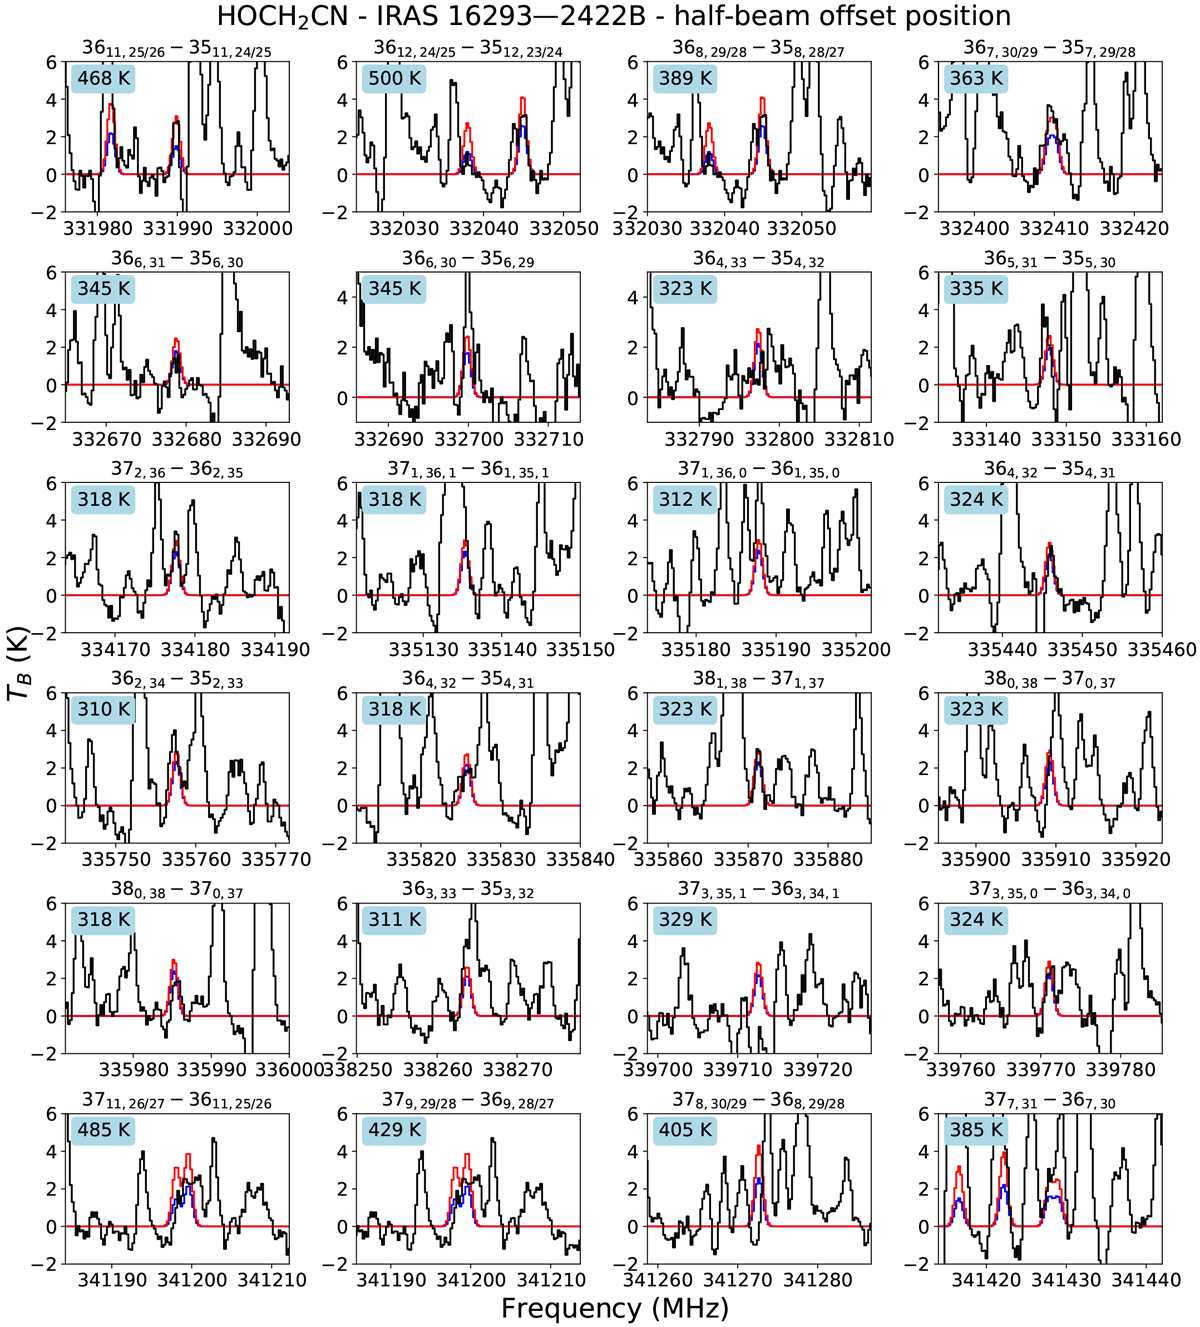
Spectral lines of HOCH2CN in the PILS spectrum towards IRAS 16293B at the half-beam offset position. The observed spectrum is plotted in black, with synthetic spectra overplotted (NT = [3.0 × 10¹⁵] cm−2, Tex = 150, blue, and 300 K, red). All covered transitions with Aij ≥ 1.0 × 10⁻³ s−1 that are not blended are shown. The transition is indicated at the top of each panel and the upper state energy is given in the top left of each panel. HOCH2CN is detected in the half-beam offset position spectrum towards IRAS 16293B.
Current usage metrics show cumulative count of Article Views (full-text article views including HTML views, PDF and ePub downloads, according to the available data) and Abstracts Views on Vision4Press platform.
Data correspond to usage on the plateform after 2015. The current usage metrics is available 48-96 hours after online publication and is updated daily on week days.
Initial download of the metrics may take a while.