Fig. 6
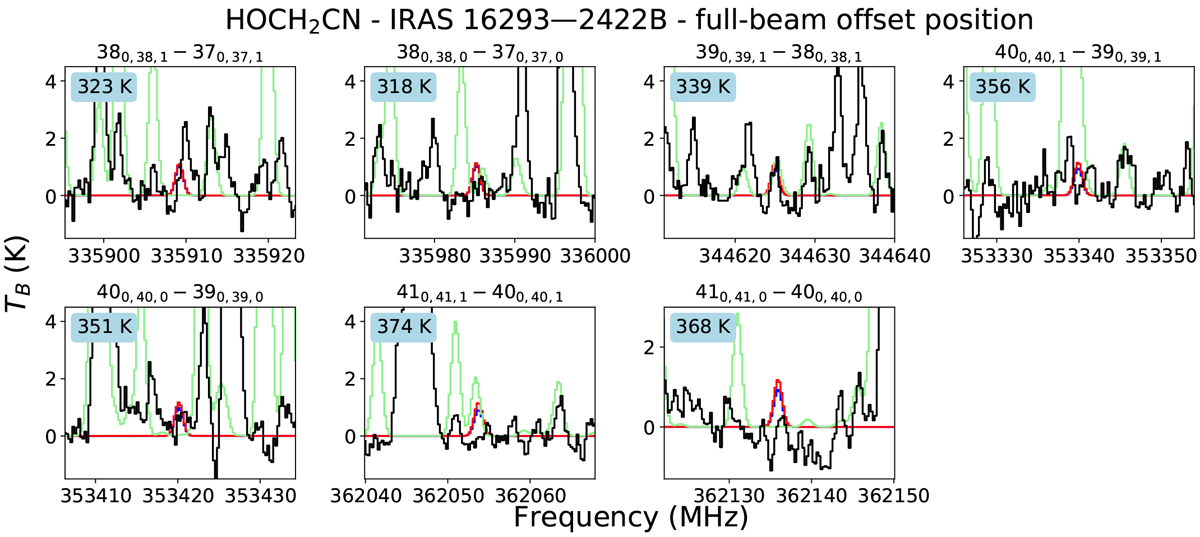
Overview of a-type (![]() –
–![]() ) HOCH2CN transitions covered by the PILS spectrum towards the full-beam offset position of IRAS 16293B, illustrating the non-detection of these lines in this spectrum. The observed spectrum is plotted in black and synthetic spectra for a column density of 1.0 × 10¹⁵
cm−2 and excitation temperatures of 150 (blue) and 300 K (red) are overplotted. The synthetic spectrum of the entire molecular inventory determined with PILS data towards this position is plotted in green. The quantum numbers of the transition are indicated at the top of each panel and the upper state energy is given in the top left of each panel.
) HOCH2CN transitions covered by the PILS spectrum towards the full-beam offset position of IRAS 16293B, illustrating the non-detection of these lines in this spectrum. The observed spectrum is plotted in black and synthetic spectra for a column density of 1.0 × 10¹⁵
cm−2 and excitation temperatures of 150 (blue) and 300 K (red) are overplotted. The synthetic spectrum of the entire molecular inventory determined with PILS data towards this position is plotted in green. The quantum numbers of the transition are indicated at the top of each panel and the upper state energy is given in the top left of each panel.
Current usage metrics show cumulative count of Article Views (full-text article views including HTML views, PDF and ePub downloads, according to the available data) and Abstracts Views on Vision4Press platform.
Data correspond to usage on the plateform after 2015. The current usage metrics is available 48-96 hours after online publication and is updated daily on week days.
Initial download of the metrics may take a while.