Fig. 2
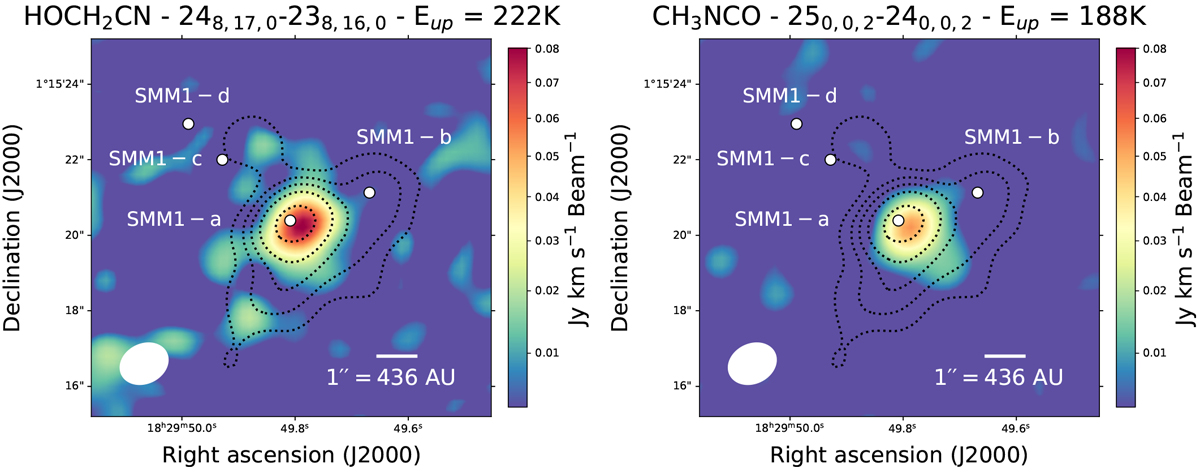
Moment 0 maps of the HOCH2CN 248,17∕16–238,16∕15, Eup = 222 K line and the CH3NCO ν = 0 250,0 –240,0, Eup = 188 K line towards SMM1. Both lines are integrated over eight velocity bins, centred on the peak frequency of each line as determined towards SMM1-a. Positions of protostars in the SMM1 region are indicated and the beam size (1.′′ 32 × 1.′′04) is visualised in the bottom left corner. Dust continuum contours are given by the black dotted line at the levels of 0.02, 0.05, 0.1, 0.2, and 0.5 Jy Beam−1.
Current usage metrics show cumulative count of Article Views (full-text article views including HTML views, PDF and ePub downloads, according to the available data) and Abstracts Views on Vision4Press platform.
Data correspond to usage on the plateform after 2015. The current usage metrics is available 48-96 hours after online publication and is updated daily on week days.
Initial download of the metrics may take a while.