| Issue |
A&A
Volume 649, May 2021
|
|
|---|---|---|
| Article Number | A175 | |
| Number of page(s) | 15 | |
| Section | Interstellar and circumstellar matter | |
| DOI | https://doi.org/10.1051/0004-6361/201937268 | |
| Published online | 01 June 2021 | |
Supersonic turbulence in giant HII regions: clues from 30 Doradus★
1
European Southern Observatory,
Av. Alonso de Cordova 3107,
Santiago,
Chile
e-mail: jmelnick@eso.org
2
Observatorio Nacional,
Rua José Cristino 77,
20921-400
Rio de Janeiro,
Brazil
3
Instituto Nacional de Astrofísica Óptica y Electrónica,
L.E.Erro 1, Sta María Tonanzintla,
72840
San Andrés Cholula, Pue.,
Mexico
Received:
5
December
2019
Accepted:
22
March
2021
The tight correlation between turbulence and luminosity in giant HII regions (GHRs) is not well understood. While the luminosity is due to the UV radiation from the massive stars in the ionizing clusters, it is not clear what powers the turbulence. Observations of the two prototypical GHRs in the local Universe, 30 Doradus and NGC 604, show that part of the kinetic energy of the nebular gas comes from the combined stellar winds of the most massive stars, the cluster winds, but not all. We present a study of the kinematics of 30 Doradus based on archival VLT FLAMES/GIRAFFE data and new high-resolution observations with HARPS. We find that the nebular structure and kinematics are shaped by a hot cluster wind and not by the stellar winds of individual stars. The cluster wind powers most of the turbulence of the nebular gas, with a small contribution from the combined gravitational potential of stars and gas. We estimate the total mass of 30 Doradus and we argue that the region does not contain significant amounts of neutral (HI) gas, and that the giant molecular cloud 30 Dor-10, which is close to the center of the nebula in projection, is in fact an inflating cloud tens of parsecs away from R136, the core of the ionizing cluster. We rule out a Kolmogorov-like turbulent kinetic energy cascade as the source of supersonic turbulence in GHRs.
Key words: hydrodynamics / line: profiles / turbulence / HII regions / ISM: kinematics and dynamics
© ESO 2021
1 Introduction
Besides the obvious difference in size, the fundamental distinction between giant HII regions (GHRs) and their smaller (mostly) Galactic counterparts (e.g., Orion) lies in the velocity width of their integrated emission-line profiles. Whereas small HII regions have thermal velocity widths, the integrated widths of GHRs are highly supersonic.
Despite decades of research and discussions, there is nevertheless still no agreement as to the origin of the supersonic turbulence in GHRs. As so many other human endeavors of our days, opinions are divided into two seemingly irreconcilable camps: the “gravity” camp, championed by the authors of the current paper in various combinations, many with other collaborators (see e.g., Fernández Arenas et al. 2018 for a recent discussion and historical perspective); and the “stellar-winds” camp led by Chu and Kennicutt (Chu & Kennicutt 1994).
The defenders of gravity argue that the surprisingly tight correlation between the global Balmer line-profile widths (σ; Hα or Hβ) and the integrated flux of these lines – the so-called L-σ relation (shown in Fig. 1) – is the unequivocal telltale signature of gravity, although the slope of the correlation (L ∝ σ5) cannot be deducted from first principles. The fact that HII region-like galaxies, or HII Galaxies also define a tight L–σ relation of similar slope is also an argument in favor of gravity.
The stellar winds camp, on the other hand, base their arguments on the morphology of GHRs, which is dominated by prominent arcs and filaments, and on high-resolution spectroscopy that shows that the emission lines associated with these morphological features are double or multiple as expected for expanding bubbles of ionized gas propelled by stellar winds.
Chu & Kennicutt (1994) showed that when the ragged shapes of the spatially resolved profiles are added up, the resulting integrated profiles have a smooth supersonic Gaussian core with broad unresolved wings matching observations of unresolved nebulae surprisingly well.
The idea that winds from individual stars can generate the observed bubbles has been disputed by Silich et al. (2020) who argue that the close proximity of the massive stars within the ionizing clusters of GHRs implies that their winds must necessarily merge into a hot cluster wind that percolates the pre-existing interstellar medium, generating the hierarchy of expanding shells that we see today. Although the difference between stellar winds and a cluster wind is fundamental, it does not change the original argument of Chu & Kennicutt (1994) in their explanation of the multiple shell structure of GHRs.
Much of the work of the promoters of the stellar-wind argument is based on observations of the two nearest and therefore best-studied GHRs in the Local Group: 30 Doradus in the LMC and NGC 604 in M33. In particular, 30 Doradus has become a sort of Rosetta Stone for deciphering the astrophysics of giant HII regions and their ionizing stars. Furthermore, the ionizing cluster of 30 Doradus (sometimes referred to as NGC 2070; others as the R136 cluster) contains the largest concentration of resolved massive stars in the local Universe, including some of the few supermassive stars known (see Castro et al. 2018 for a recent review).
Chu & Kennicutt (1994) argued that about 50% of the kinetic energy of the nebular gas in 30Dor is in the expanding shells and 50% in someunspecified form of general turbulence. These latter authors argued that the collective mass of stars and gas in the nebula (M ~ 5 × 10⁵ M⊙) is not enough to generate the observed turbulence through the gravitational potential.
The aim of the present paper is to use new public FLAMES/GIRAFFE data to perform a (renewed) detailed investigation of the nature of the supersonic turbulence of the nebular gas in 30 Doradus.
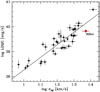 |
Fig. 1 L–σ relation for GHRs adapted from Fernández Arenas et al. (2018). |
2 The kinematics of the nebular gas in 30 Doradus
The large angular size of 30 Doradus (or 30Dor) has made it difficult to fully map the kinematics of the nebular gas. Smith & Weedman (1972) used a single-channel Fabry-Perot (FP) interferometer to observe a number of positions in 30Dor with spatial resolutions of 13″;30″;120″. (Melnick 1977; reproduced in Melnick et al. 1987) followed up on these observations and showed that the structure function of turbulence in 30Dor was flat, albeit with a spatial resolution of only 13″ = 3.25 pc. However, long before that Feast (1961) had already found that there was very little structure in the turbulence of the nebula. Chu & Kennicutt (1994) improved upon these previous studies by dissecting 30Dor using long-slit Echelle spectrograms that provided a significantly better spatial coverage, particularly in the outer regions of the nebula. These latter authors found that the velocity field of the nebula is dominated by expanding shells of a wide range of diameters, and concluded that the supersonic velocity-width of the integrated Hα profile was by and large the result of these expansion motions, although the shells accounted for only about 50% of the kinetic energy of the gas. They also dismissed the contribution of gravity in stirring up the gas kinematics.
Melnick et al. (1999) refined the observations of Chu & Kennicutt (1994) using higher spatial and spectral resolutions, albeit at only one slit position. These authors confirmed that the supersonic Hα profiles are resolved into multiple components, but at all positions along the slit they found a very broad unresolved component of unknown origin. More recently, Torres-Flores et al. (2013) used the multiplexing capability of FLAMES/GIRAFFE on the VLT to address some of the issues raised by Chu & Kennicutt (1994) and Melnick et al. (1999). While Torres-Flores et al. (2013) largely confirmed the findings of these earlier studies, they questioned the reality of the broad unresolved component identified by Melnick et al. (1999).
For the ensuing discussion it is important to recall that several phases of the interstellar medium coexist within 30 Doradus: the region seems to contain significant amounts of molecular and atomic hydrogen (Ochsendorf et al. 2017 and references therein); there is the ionized gas at 104 K, which we refer to here as the nebular gas; and there is a very hot X-ray-emitting medium at 107 K that we refer to as the hot gas. Here, when we talk about supersonic motions we are referring to the gas at 104 K and a sound speed of cs = 9.1 km s−1 for hydrogen.
2.1 30 Doradus in FLAMES
2.1.1 Overall nebula
Torres-Flores et al. (2013) raised doubts about the reality of the broad component of the integrated Hα profile of 30Dor identified by Melnick et al. (1999), and therefore it seems relevant to begin our analysis by revisiting this issue in order to set the ensuing discussion on self-consistent grounds. We used a subset of the data discussed by Torres-Flores et al. (2013), which we downloaded pipeline-processed from the ESO Archive (Phase3). We discarded from this dataset all points showing discernible contamination of the nebular profiles by stellar features, leaving a total of 1668 individual spectra in our full sample.
Figure 2 shows the integrated profiles determined from these data in two different ways. The top panel shows the average of the 1668 individual FLAMES/GIRAFFE spectra. (Torres-Flores et al. 2013; see also our Fig. 7) provide graphical illustrations of how the data points are spatially distributed in the nebula showing that the central regions are more densely sampled than the outskirts, mostly by the VLT Flames Tarantula Survey observations (Evans et al. 2011). Therefore, in order to check for effects that this inhomogeneous sampling may introduce, the lower panel shows the integrated profile using only the data from the uniform grid of Torres-Flores et al. (2013) for a total of 879 points.
Our Gaussian fits for both the full-sample and uniform-grid profiles are surprisingly similar given the differences between the two samples. The widths of the profiles also agree with those of Melnick et al. (1999) and Torres-Flores et al. (2013) for the core of the line, but the broad component of Torres-Flores et al. (2013), σ2 = 49.1 km s−1, is significantly broader than ours (σ2 = 41.3 km s−1; lower panel) for almost the same data. The discrepancy is much larger than the formal fitting errors (< 1 km s−1), but it is well known that the parameters of multi-Gaussian fits are sensitive to the statistical errors of the data, which probably explains the discrepancy. We used the errors provided by the ESO Phase3 pipeline propagated through the various manipulations of the data, but we do not know how Torres-Flores et al. (2013) estimated the corresponding errors. Melnick et al. (1999) fitted two Gaussians to the total profile of Chu & Kennicutt (1994) and found σ1 = 26 km s−1 and σ2 = 44 km s−1, without including errors. We note that two Gaussians do not fit the center of the line for which a third component would be required.
2.1.2 Radial bins
The outer regions of the nebula have been characterized by Chu & Kennicutt (1994), and so here we concentrate on the inner (r < 40 pc) part of 30Dor that contains the bulk of the ionizing stars and has a complex structure that was not well covered in the study of Chu & Kennicutt (1994).
To begin, we present in Fig. 3 profiles integrated over seven radial rings of radii indicated in the legend. For each ring, the figure shows multiple Gaussian fits with the minimum number of components required to reproduce the observations.
We insist throughout this work that multiple-Gaussian fits are seldom unique, being increasingly sensitive to data errors and to the initial guesses as the number of Gaussian components increases, and so we must be conservative when interpreting the results from these fits. Nevertheless, Fig. 3 shows several robust features relevant to the present study. One is that the innermost ring (r < 10 pc) shows two intense peaks that tell us that the kinematics of the very center of the nebula is dominated by a massive wind that is blowing away the gas at high speeds. However, despite this raging wind, there is still plenty of gas at the center of 30Dor as indicated by the intensity scale.
A second feature is that there is a dramatic change in the kinematics at r = 25 pc. Beyond this radius, the profiles become broader and increasingly show the emergence of a second redshifted component. Thus, beyond 25 pc we see the onset of the “large expanding-shells” regime. A third feature is that the surface brightness drops dramatically as the structure of the gas becomes increasingly dominated by the large shells described by Chu & Kennicutt (1994).
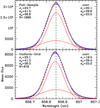 |
Fig. 2 Top: integrated Hα profile of 30 Doradus using all the available data (1668 points). Two Gaussian components are required to fit the core and the wings of the line shown by the thin red lines. The data are shown asblue points and the sum of the two Gaussians by the red dashed lines. The legend reports the measured (left) and corrected for instrumental and thermal broadening (right) widths (σ) of each component plus the width from a single Gaussian fit (σ0 shown by the black lines). Bottom: same as top, but using only 879 points from the uniform grid of Torres-Flores et al. (2013). The heliocentric radial velocity of 30Dor obtained from the full sample is V30Dor = 264.8 km s−1 for an Hα rest wavelength of 656.2804 nm. |
2.2 Profile taxonomy
The atlas of gray-scale spectrograms of Chu & Kennicutt (1994) shows that almost everywhere in the nebula the Hα profiles tend to break up into multiple components. However, the high contrast of the atlas prints makes it difficult to precisely discern the profile shapes. Therefore, we were surprised to discover upon visual examination of our 1668 Hα profiles on the computer screen that the majority of the profiles can actually be divided into three well-defined groups illustrated schematically in Fig. 4.
The vast majority of the profiles are either single or double, although multiple profiles also contribute a substantial fraction. We emphasize that here we are describing the Hα profiles. We discuss the forbidden lines in the following section. Like the integrated profile, single profiles have Gaussian cores and broad non-Gaussian wings. Double and multiple profiles are characterized by having two or more smooth components of comparable (within factors of a few) peak intensity that are well separated in radial velocity. The radial velocity of the stronger component generally appears to be closer to zero, whereas the weaker peak is either redshifted or blueshifted relative to the stronger component.
We mention in Sect. 1 that Chu & Kennicutt (1994) concluded that 50% of the kinetic energy of the gas is in the expanding shells and 50% in some form of unspecified turbulence. Assuming that double and multiple represent pure expansion, the single profiles must convey information about that “unspecified” form of turbulence. Therefore, it is important to quantify the distinction between single and multiple profiles.
We used an algorithm based on first and second derivatives to detect multiple peaks using the signal-to-noise ration (S/N) of the continuum to identify spurious peaks. Most of the profiles show some degree of low-level asymmetry, which does not make them multiple in the sense of having more than two peaks of comparable intensity. Therefore, we introduced a finer distinction in order to separate single from multiple profiles. We define “double” profiles as those where the ratio of peak intensities between the first (strongest) and second components P2 ∕P1 > 0.1, and “multiple” profiles as those with three or more components with P3∕P1 > 0.15.
The peak-finding algorithm yields 1067 singles, 453 doubles, and 148 multiples, confirming our initial impression that multiple profiles are less abundant but still numerous. Visual examination reveals that a good fraction of singles are in reality doubles, where the radial velocities of the peaks are too close to be detected by our peak-finding algorithm.
As the Hα profiles are blurred by thermal motions that hide components with a small difference in radial velocity, we refined our separation of single and multiple profiles using the lines of [NII] and [SII], which have much smaller thermal broadenings (2.4 and 1.6 km s−1 respectively). However, this “solution” turned out to be complicated, as discussed below.
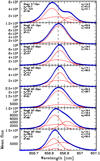 |
Fig. 3 Integrated profiles of the core of 30Dor (r < 40 pc) and seven radial bins identified in the figure legend, which quotes the inner and outer radii of each ring in parsecs. The legend also provides the widths of the multi-Gaussian fits of each ring (right) and the width and radial velocity, denoted as 0, of the single Gaussian fit (that is not plotted) relative to the integrated velocity of the nebular core (left), which defines our rest frame for 30Dor. |
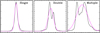 |
Fig. 4 Cartoon illustrating the three typical shapes of our 1668 profiles. The intensity ratios of the double and multiple components vary widely as discussed in the text. The purple lines show single Gaussian fits to the particular profiles illustrated in the cartoons. |
2.3 [NII] and [SII] kinematics
Using the [NII] and [SII] lines (henceforth the forbidden lines) to characterize the nebular gas kinematics entails two problems. The first most obvious one is that the lines are much weaker than Hα and their S/N is often too low for a reliable characterization of the profiles. The second and less obvious problem is that in general the peak intensities of the multiple components of Hα differ from those of the forbidden lines, as in the example shown in Fig. 5.
It is therefore not appropriate to use the morphology of the forbidden lines to characterize the kinematics of Hα (and vice versa). For this reason, we only used the forbidden lines to flag single and multiple profiles, and we searched formultiple components in all profiles thus flagged by subtracting single Gaussian fits from the observed Hα profiles and fitting multiple Gaussians – using the positions of the residual peaks as initial guesses – to measure the peak intensities.
In this way, we find that 599 of the 1067 lines classified as “single” in Hα by the peak-finding algorithm are in reality double in [NII] and/or [SII] and confirm that they have P2 ∕P1 > 0.1 at Hα, while 30 profiles previously classified as double are confirmed to be multiple (P3 ∕P1 > 0.15).
Relevant statistics from the three families of Hα profiles are presented in Table 1, which lists average radial velocities of the strongest components ⟨ V1 ⟩ ; the average peak intensity ratios; and the average velocity-widths from single-Gaussian fits (uncorrected for instrumental and thermal broadening; ⟨ σ⟩). The ± values give the rms dispersions from the means.
Using the partition of single and double profiles we can now quantify our second, initial visual impression that the stronger component is generally at rest in the frame of the nebula, while the weaker component is either redshifted or blueshifted relative to the strong component. Fig. 6 shows the histograms of radial velocities of the two components of our “double” profiles. As in Table 2, P1 corresponds to the strongest peak and P2 to the weaker one.
It should be obvious from these distributions and the data of Table 2 that the integrated profile of 30Dor can be deconstructed into a sum of Gaussians representing the components of the double peaks plus the single peaks and their rms radial velocity dispersion.
Finally, let us look at the spatial distribution of our three families of profiles. This is presented in Fig. 7 where we have color coded the positions according to morphology. Doubles tend to concentrate inside the large expanding shells; singles tend to delineate the high-surface-brightness borders of these shells; while multiples share the distribution of doubles.
The image illustrates that the profiles inside the large Chu–Kennicutt bubbles are double or multiple, while at the edges of these giant shells the profiles are mostly single. We have color coded the single profiles according to their peak radial velocities relative to the systemic velocity of 30Dor (265.4 km s−1) from our Hα data. The edge of Chu–Kennicutt#2, which has been very well mapped in search for photodissociation regions, is seen to be blueshifted, indicating that the shell is expanding towards us, while the inside shell that was identified by Chu & Kennicutt (1994) but not numbered is completely delineated by red dots.
The single profiles therefore delineate the edges of the expanding shells as well as the dense filaments and loops that characterize the core of the nebula; these are described in detail below. We note that the blue and the red dots are rarely mixed showing that the densest parts of the nebula as a whole are expanding.
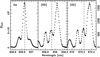 |
Fig. 5 Profile shapes of Hα are generally different from those of the forbidden lines. The vertical dashed lines correspond to the wavelengths at the heliocentric radial velocity of 30Dor from the sum of the single Hα profiles V30Dor = 265.4 km s−1. |
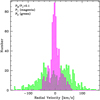 |
Fig. 6 Distribution of radial velocities relative to the rest frame of 30Dor of the two components of the double profiles. P1 (magenta) represents the component with highest peak intensity and P2 (green) the weaker component. |
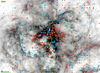 |
Fig. 7 Public Hα image of 30Dor taken with the Wide Field Imager on the 2.2 m telescope of La Silla. The dots and crosses show the positions of the three families of profiles discussed in the text, color-coded as follows: blue for blueshifted single profiles; red redshifted single profiles; yellow crosses double profiles; and cyan dots multiple profiles. The red and blue dots with white rims have radial velocities close to zero (|V | < 2.5 km s−1). The lower-right corner (SW) of the image portrays the slow expanding shell of the supernova remnant 30DorB. The scale shown in the lower-left corner corresponds to 15 pc. |
Kinematics from single profiles.
Taxonomy of Hα profiles in 30 Doradus.
2.4 Single-profile kinematics
Assuming that the kinematics of the nebular gas represented by double and multiple profiles is dominated by expanding motions, single profiles should provide information about the 50% of the total kinetic energy of unknown forms of turbulence mentioned by Chu & Kennicutt (1994). Above, we show that the radial velocities of the single profiles are dominated by expansion motions, but the individual profiles also have supersonic widths.
Table 1 summarizes the average intrinsic width (i.e., corrected for instrumental and thermal broadening) and heliocentric radial velocity of the single profiles for Hα and for the forbidden lines.
The table shows that the forbidden lines are on average ~ 1.3 km s−1 narrower than Hα. Figure 8 shows the stacking of the single [NII] and Hα profiles after rebinning the data to v = 0. We have repeatedly warned of the dangers of multi-Gaussian fits, but in the case of Fig. 8 a minimum of three components is required to fit the core and the wings of the lines. Indeed, there are good physical reasons to fit three components; we have already encountered two: σ1, the main peak, and σ3, the broad unresolved component that pervades the nebula. The third component (σ2) corresponds to the sum of all the low-intensity components that do not meet our P2 ∕P1 > 0.1 and/or P3 ∕P1 > 0.15 conditions.
A second interesting feature of Fig. 8 is that, as already shown in Table 1, the Hα profile is broader than [NII] by 1.6 km s−1. The difference is somewhat larger than the value of 1.3 km s−1 from the table, where the same weight is assigned to all profiles independently of peak intensity, and so the agreement is actually quite good.
We verified that the systematic difference in the line widths is not due to a geometrical effect (see Appendix A). In fact, Hippelein (1986) found a similar systematic difference between [OIII]500.7nm and Hα for the integrated profiles of a small sample of giant HII regions and HII Galaxies. This difference has been confirmed by several authors, notably Melnick et al. (2017) for a substantial sample of HII Galaxies. A similar effect was also observed in the Orion nebula by García-Díaz et al. (2008) but there is no consensus in the literature as to the origin of the discrepancy. However, we note that while the intrinsic width of Hα (σ1) is the same as the sound speed for hydrogen at 104 K, the [NII] profiles are highly supersonic, suggesting that perhaps they could be resolved into even more components.
We also measured the intrinsic widths of each of the individual components of double Hα profiles – taken separately – using two Gaussians to fit the doublet plus a third Gaussian to fit the extended wings, using an automated procedure. We find an average width of 11.7 ± 4.7 km s−1 for these components, comparable to the values given above for the average width of single profiles (11.9 ± 3.4 km s−1).
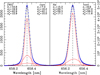 |
Fig. 8 Left: stacked [NII] single profiles rebinned to zero redshift using a wavelength of 656.2804 for Hα. The red lines show the three Gaussian components necessary to fit the data. The blue dots show the data, and the black line the overall fit. The legends give the observed width of each component(top left), and the widths corrected for instrumental and thermal broadening (top right). σ0 corresponds to a single-Gaussian fit. Right: stack of Hα profiles. |
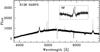 |
Fig. 9 HARPS spectrum of the center of 30 Doradus (R136) showing the broad features of the massive WN7h stars in the core of its ionizing cluster. The insert shows the nebular Hβ line superposed on the broad absorption trough of the stellar component. |
2.5 The [OIII] profiles with HARPS
We speculated above that a possible explanation for the reason the intrinsic width of single [NII] profiles is highly supersonic while Hα is not could be that at higher resolution the profiles would be resolved into multiple narrower components. We therefore observed two characteristic regions of 30Dor with HARPS: one at the very center (R136), and a second at the position of Filament F from the NTT observations of Melnick et al. (1999), located 8pc due west of R136. The original purpose of this pilot project was precisely to resolve the profiles further, and to verify whether or not the forbidden [OIII] lines also showed the broad unresolved component seen by Melnick et al. (1999) at Hα.
HARPS provides a spectral resolution of R = 100 000 covering the spectral range between 370nm and 690nm with a spatial resolution of 3″ determined by the entrance fiber. Figure 9 shows the HARPS spectrum of the center of 30Dor (R136), which nicely illustrates the extremely broad “feet” of the Balmer lines from the massive WN7h stars in R136 that provide a significant fraction of the total ionizing flux (Doran et al. 2013). Similar features are observed at several positions within the nebula where such massive stars are found (Evans et al. 2011).
Figure 10 presents a comparison between the Hα and the [OIII]5007 Å nebular profiles at the two positions observed with HARPS1.
The Hα profiles shown in the bottom panels of the figure are double in the sense discussed above: they can be fitted reasonably well using two Gaussian components for the two main peaks plus a third for the broad extended wings. The [OIII] lines, on the other hand, have higher S/N and much smaller thermal broadening (2.3 vs. 9.1 km s−1 at 104 K), allowing us to discern a significantly more complex structure at the same positions, which requires at least seven components plus one for the broad wings at the center, and at least five components plus the broad wings for Filament F. The corrected velocity widths of the individual components are given in the figure legends.
Although the [OIII] line resolves into several components, these are still supersonic at 104 K, but again we must warn of the dangers of multi-Gaussian fits. The solutions shown in Fig. 10 result from leaving all parameters free. It is possible to obtain solutions by forcing the widths of all components to be narrow, say σ = 3 km s−1, albeit only after carefully fine-tuning the initial guesses of all other parameters. Therefore, we can neither prove nor rule out that the [OIII] profiles are the sum of many subsonic components, for which we would need much higher S/N data.
Nevertheless, our results clearly show that the individual components of double profiles are resolved into a number of narrower components indicating that there is structure in the expanding shells at the spatial resolution of HARPS (0.75pc). The radial-velocity dispersion of these components is “typically” (we only have four examples) ~ 11 km s−1, which is similar to the value measured from the unresolved shells and filaments.
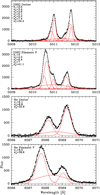 |
Fig. 10 Nebular line profiles at the two positions observed with HARPS. Hα profiles in the bottom panels and [OIII]5007 in the top panels. The multi-Gaussian fit components are plotted in red and the solid black line shows the overall fit. |
3 The kinematical core of 30 Doradus
3.1 Structure
Figure 3 shows that there are two inflection points in the integrated profiles of the central part of 30Dor: the region r < 10 pc, where the profile is double and the kinematics dominated by the massive cluster wind emerging from the stars in the cluster core (R136); and the region r > 25 pc where expanding motions increasingly dominate the profile shapes. We used finer bins to verify that the latter change is already visible between 25 pc and 27 pc.
The radial Hα brightness distribution shown in Fig. 11 also shows features (i.e., changes of slope) at r ~ 10 pc and r = 25 pc amid a broad peak that encompasses23% of the total Hα flux of the nebula and the bulk of the ionizing stars, and where the cluster wind that drives the hierarchy of Chu–Kennicutt shells originates.
Figure 12 shows that the width of the integrated profile of the region r ≤ 25 pc (henceforth the kinematical core) is virtually identical to that of the nebula as a whole (the only significant difference being the width of the broad component). Therefore, the ratio of kinetic energies of the nebula as a whole and the kinematical core is just the ratio of the Hα luminosities; the core contains 23% of the total kinetic energy of the nebular gas in 30Dor. Perhaps tellingly, the shape of the profile of the kinematical halo (r > 25 pc; the realm of the large expanding bubbles) is almost identical to those of the core and of the overall nebula.
Figure 13 presents a zoom into the central 30pc of 30Dor seen in X-rays (right) and Hα (left). Overlaid on these images are dots that are colored coded according to profile shapes and kinematics.
Single profiles delineate bright (dense) Hα filaments, and lie at the edges of bright X-ray zones. These dense filaments define the “head” of the Tarantula, which, as shown by the distribution of blueshifted and redshifted profiles (blue and red dots), consists of several expanding bubbles that are the mouth and the eyes of the spider. The large elliptical bubble that surrounds R136 is asymmetrical, with the eastern side being more luminous in X-rays. This “mouth of the Tarantula” opens towards the east indicating that the hot gas is escaping through the mouth to inflate the giant bubble Chu–Kennicutt#2.
There is another expanding bubble due North of R136 that is very bright in X-rays and that is open to the north toward the giant Chu–Kennicutt#5 shell. Similarly, the bubble due south of R136 seems to be inflating Chu–Kennicutt#1. Therefore, we get the impression that the dense filaments that define the head of the Tarantula act as nozzles that channel the cluster wind from the source (R136) out to the giant Chu–Kennicutt shells.
The clumpy structure of the hot cluster wind seen in the X-ray image is mostly due to shadowing by the dense dust + gas structures clearly shown in the Hα image. The X-rays are faint in places where the Hα emission is bright and blueshifted, indicating that the nebular component is in front of the hot gas, and vice versa. Receding filaments seem to lie behind that hot gas, but not always; the bright loop directly NW of R136, where the X-rays are faint, is redshifted. However, the giant shell Chu–Kennicutt#3 is adjacent, and so it is possible that the hot wind has already escaped from that region.
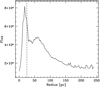 |
Fig. 11 Radial Hα brightness profile of 30Dor obtained by integrating the flux in incremental rings of 1pc. The dashed line shows the radius, r = 25 pc, where the kinematics shown in Fig. 3 shows a distinct inflection point. |
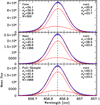 |
Fig. 12 Comparison between the integrated Hα profiles of the whole nebula (bottom) and the profile of the kinematical core (r ≤ 25 pc) and that of the kinematical halo (r > 25 pc). The blue points are the data and the thick-dashed red line is the fit of two Gaussian components shown in thin red. The single-Gaussian fit is shown by the black line. The parameters of these components, observed and corrected for instrumental and thermal broadening, are shown in the legend. |
3.2 Kinematics
To compare with the results of Chu & Kennicutt (1994), Table 3 presents an estimation of the kinetic energy budget of the nebular gas. The total kinetic energy is  where σ0 is the integrated velocity dispersion of the gas estimated from the single-Gaussian fit of Fig. 2 and Mgas = 4 × 10⁵ M⊙ is the total mass of nebular gas according to Chu & Kennicutt (1994). The values for the kinematical core and halo are obtained assuming that the mass of gas is proportional to the Hα luminosity.
The kinetic energy of the “general” turbulence was calculated as follows. We saw that the single Hα profiles as well as each of the two components of double Hα profiles have average widths of ~ 11.8 km s−1. We do not know the source of energy that sustains these motions, but we do know that when we observe the same profiles in the forbidden lines, they are resolved into many narrower components. We also ignore the mass of these turbulent shells and filaments, but as they comprise the brightest regions of 30Dor, it is reasonable to assume that they contain most of the nebular mass (assuming that the mass is proportional to the Hα luminosity).We calculated the velocity dispersion in two ways: directly from the average profile widths (min) and convolving the profile width with the radial-velocity dispersion of the single profiles (max),  km s−1.
Because at least some, and probably much, of the radial-velocity dispersion of the single profiles is due to expansion motions, the velocity dispersion of 11.9 km s−1 given in the table is a maximum. Thus, the fraction of the total kinetic energy contained by general turbulence is closer to 25% than to 45%, compared to 50% estimated by Chu & Kennicutt (1994).
4 Turbulence
4.1 Kolmogorov turbulence
Observations of the other prototypical GHR in the local group, NGC 604, by Medina-Tanco et al. (1997) appear to show a well-developed Kolmogorov-like kinetic energy cascade in that nebula. These latter authors found that the structure function,
![\begin{equation*}S_2(\textbf{r}) \;{=}\;{\langle}[v(\textbf{x})-v(\textbf{x}+\textbf{r})]^2{\rangle}, \end{equation*}](/articles/aa/full_html/2021/05/aa37268-19/aa37268-19-eq3.png) (1)
(1)
which is the square of the difference in radial velocity between two points separated by a distance r averaged over all pairs of positions separated by r, is a power-law of slope ~5∕3 for r ≤ 10 pc and flattens at larger separations.
By definition  so if ⟨v⟩ = 0, the structure function becomes S2 = 2σ2, and therefore it is convenient to normalize by the square of the radial-velocity dispersion σrv such that the normalized function peaks at S2 ~ 2 (Arthur et al. 2016). Figure 14 reproduces the normalized structure function of NGC 604 calculated using the same radial-velocity data of Medina-Tanco et al. (1997) kindly provided by Gustavo Medina-Tanco.
We used our full sample to construct the structure function for 30Dor as for NGC 604, but using three different ways of measuring the radial velocities. The top panel of Fig. 15 corresponds to the method adopted by Medina-Tanco et al. (1997) of fitting single Gaussians to all profiles. The second, shown in the middle panel, uses the radial velocity of the strongest peak at each position; and the third uses only the single profiles. Typically, each point in the top two panels is the average of 16 000 to 78 000 pairs, except for the smallest separation that has only 6500 pairs. The vertical bars represent the rms dispersion around each average.
Contrary to that of NGC 604, the structure function of 30Dor has no structure: it is flat. As the L–σ relation of Fig. 1 implies that the kinematics of GHRs depends only on their luminosities, we expected 30Dor and NGC 604 to have similar, if not identical, structure functions, which turned out not to be the case.
Unfortunately, there are several problems and inconsistencies with the results of Medina-Tanco et al. (1997). The first and most obvious is seeing. The red bar in Fig. 14 at 4.1 pc corresponds to the seeing (1″) reported for the Taurus-II observations of Sabalisck et al. (1995) upon which the structure function is based. The separation of the first two points in the structure function is less than the seeing, while the next two points at < 2″ are also affected by seeing. These four points define the slope of the function for r < 10 pc. After removing these four seeing-affected points, the remainder of the structure function of NGC 604 is almost flat.
A second issue that may blur the comparison between 30Dor and NGC 604 is beam smearing. At the distance of M 33, 1″ = 4.1 pc, while the data of Medina-Tanco et al. (1997) were binned to 2″ × 2″, which results in a significant smoothing of the radial velocities. There are also some problems with the TAURUS-II data for NGC 604. For example, the TAURUS-II profiles of Muñoz-Tuñón et al. (1996) are substantially broader than the TAURUS-I (plus Echelle) results of Yang et al. (1996). We were unable to recover the original data to check these issues, and so for the moment it seems safer to ignore the results of Medina-Tanco et al. (1997), although we cannot overemphasize the importance of re-observing NGC 604 hopefully at a higher spatial resolution.
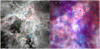 |
Fig. 13 Left: central 60 pc of 30 Doradus in Hα using a public domain image taken with the 2.2 m/WFI imager on La Silla. North is upwards; East is to the left. Right: Chandra 20-year anniversary X-ray image of the same region (credit: NASA/CXC/Penn State Univ./L. Townsley et al.). The two images have been astrometrically matched using point-like X-ray sources and the software package Aladin (Bonnarel et al. 2000). The cross near the center shows R136, the core of the ionizing cluster (the second cross on the X-ray image shows one of the astrometric references). The red and blue dots show the positions of red- and blueshifted single profiles relative to the systemic velocity of 30Dor, V30Dor = 265.4 km s−1. The orange crosses mark positions where the profiles are double and the green dots show the positions of the multiple (mostly triple) profiles. The yellow line draws the contours of the giant molecular cloud 30Dor-10 (Indebetouw et al. 2013). |
Kinetic energy budget.
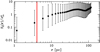 |
Fig. 14 Structure function of the central region of NGC 604 using the same radial-velocity data from Medina-Tanco et al. (1997). The red bar shows the radius (4.1 pc) corresponding to the seeing disk (1″) of the TAURUS-II observations used to construct the structure function. |
4.2 Gravity
Chu & Kennicutt (1994) dismissed gravity as an important source of kinetic energy, stating that “even the largest imaginable mass for 30Dor” would be inadequate to explain the velocity dispersion of the gas inferred from the width of the integrated profile, σ0 = 23.5 km s−1 (Fig. 12). However, we know, as they knew, that a major part of this width is furnished by expanding shells. So let us revisit the issue.
We calculated the structure function of an N-body model of a 103 M⊙ virialized cluster containing 2000 particles of equal mass (kindly provided by Sverre Aarseth) shown in Fig. 16.
The match is not perfect, but still provides a much better match than a Kolmogorov turbulent energy cascade. This does not prove that gravity is driving the turbulence in 30Dor, but at least provides a consistency check.
Another way of probing the effect of gravity is to estimate the mass required to generate the observed motions through the virial theorem. The morphology of 30Dor and the results of Chu & Kennicutt (1994) show that the outer parts of the nebula are dominated by expanding motions, and so here we restrict our analysis to the kinematical core.
Figure 17 shows the radial-velocity dispersion σrv (in red) and the mean velocity width (in blue) of the single profiles plotted as a function of radius. Each bin contains 50–70 points except for the first bin (10 < r ≤ 25 pc) which contains 98 single profiles. We excluded the central 10pc, which is completely dominated by expansion motions.
The average width of the profiles in the kinematical core is ⟨ σcore⟩ = 11.2 ± 3.0 km s−1 and the radial-velocity dispersion is σrv = 15.3 km s−1. The respective minimal and maximal turbulent velocities in the core are therefore σmin = 11.2 km s−1 and  km s−1. Assuming an effective radius of 10 pc for the core, the corresponding mass limits from the virial theorem are,
 (2)
(2)
The observed (photometric) mass of the kinematical core is quite uncertain, the stellar mass being probably the least uncertain. Selman et al. (1999) quote a mass of M* = 68 000M⊙ which results from integrating the observed (power-law) initial mass function (IMF) between 3 M⊙ and 120 M⊙. The low-mass (m < 3M⊙) IMF of 30Dor is not known, but the IMF of most young star forming regions turns over at masses of ~ 0.5M⊙ (Bastian et al. 2010). Extrapolating the IMF of Selman et al. (1999) down to 0.5 M⊙, yields a total stellar mass of M⋆ = 1.5 × 10⁵ M⊙ for 30Dor, 50% larger than the value generally quoted in the literature (e.g., Doran et al. 2013 and references therein).
The mass of ionized gas is more uncertain. Here we adopt the value of MHII = 4.5 × 10⁵ M⊙ from Chu & Kennicutt (1994), which according to these authors is uncertain by factors of between two and four. Ochsendorf et al. (2017) derive a similar mass with an uncertainty of “only” a factor of two (0.2 dex). The most uncertain component is the mass of neutral and molecular gas also discussed by Ochsendorf et al. (2017). A comprehensive review of this contribution is well beyond the scope of the present paper, but in Appendix B we present a summary and justify our optimistic value of MHI+H2 = 9 × 10⁴ M⊙ for the amount of neutral and molecular gas within the nebular core.
The core of 30Dor contains the bulk of the stars and 23% of the Hα luminosity, and so the total mass within the kinematical core is,
 (3)
(3)
which is comfortably above the minimum value required by Eq. (2). Therefore, again, we may have consistency, but not proof.
Simple and direct proof would be to show that the velocity dispersion of the stars is consistent with that of the gas. However, unfortunately, this test turns out to be neither simple nor direct. Bosch et al. (2001) and Bosch et al. (2009) found a surprisingly large velocity dispersion for NGC 2070 that can be explained if a large fraction of the massive stars in the cluster are binaries. Subsequently, binary orbits were measured for many of these stars confirming that conclusion (Hénault-Brunet et al. 2012a). There are several other complications related to mass segregation and rotation (Hénault-Brunet et al. 2012b) that compromise the putative simplicity of the test, but the observations show that, at least in the cluster core (r < 5 pc), the stars are in virial equilibrium (Hénault-Brunet et al. 2012a,b).
To conclude this discussion, let us revisit the mass required to explain the integrated velocity dispersion by gravity. Adding up the HII mass (4.5 × 10⁵), the stellar mass (1.5 × 10⁵), and the molecular mass (1.8 × 10⁵) the total mass of the nebula is M30Dor = 7.8 × 10⁵M⊙. The half-mass radius is therefore close to the radius of the kinematical core (r = 25pc), but much smaller than the value of 100pc assumed by Chu & Kennicutt (1994). The viral mass for a velocity dispersion of 23.5 km s−1 and an effective radius of 25 pc is 3.2 × 10⁶M⊙, which is still significantly larger than our optimistic value for M30Dor but is by no means “the largest imaginable”.
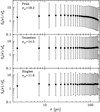 |
Fig. 15 Normalized structure function of 30 Doradus. Top: using the radial velocities of the strongest peak of each profile. Mid: radial velocities measured from single-Gaussian fits. Bottom: using only profiles classified as single. |
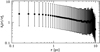 |
Fig. 16 Structure function of a virialized cluster of 2000 particles. All particles have equal mass and the total mass of the cluster is 103M⊙. For a virialized system S2(r) ≃ 2σ2 and the velocity dispersion σ is constant in the core. |
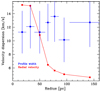 |
Fig. 17 Velocity dispersion as a function of radius from the single profiles. The red points and line show the radial-velocity dispersion of the profile centroids and the blue points show the average width of the profiles in each radial bin. The horizontal error bars show the size of the bins, and the vertical bars show the rms dispersions of the average widths. |
4.3 Small-scale turbulence
We have seen that there is no large-scale supersonic hydrodynamical turbulence in 30 Doradus, and that the gravitational potential is not strong enough to furnish the kinetic energy of the gas: The large-scale structure of 30Dor is organized by the cluster wind, but the wind-driven shells are themselves turbulent.
This “small-scale” turbulence could be due to Kolmogorov-like kinetic energy cascades powered by the wind, such as those observed in the Orion nebula (Arthur et al. 2016). However, even within the shells and filaments of 30Dor, we are looking at spatial scales orders of magnitude larger than the turbulent regions in Orion, and so we have no hope of resolving the turbulent cascade. However, our data (mostly HARPS but also some FLAMES profiles) show that the forbidden profiles can be resolved into many components with radial-velocity dispersions similar to the widths of the profiles. Such multiplicity would explain why, at the same positions, the Hα profiles are subsonic but highly supersonic in the forbidden lines.
An intriguing possible explanation for the small-scale turbulence is that sections of the leading shocks composing the large structures lose energy by radiation as the medium they sweep piles up in front, and therefore secondary shocks emanate from the hot gas to transmit the interior pressure. These “shockletts” slam first into the swept-up gas and eventually into the leading shocks giving them small jolts that here we relate to the structure we observe in the forbidden lines.
The ionization of the 30Dor nebula is by and large provided by the massive stars, with a small contribution from shocks that, in principle, should be more important in the denser parts of the nebula (Pellegrini et al. 2011). Figure 18 shows the shock-sensitive diagnostic diagram that can be obtained using our FLAMES spectra, and is color coded according to the distance to R136.
The figure shows that emission from low-velocity shocks is clearly visible in the faint, low-density external regions of the nebula2, but not in the dense central regions of the nebula. This does not mean that shocks are not present in these regions; it only means that at optical wavelengths they are completely overshadowed by photoionization, perhaps reflecting how the cooling process operates behind the leading shocks as these continue to ram into a cloudy medium of widely different densities. This also determines the speed of the shockletts driven into the nebular swept-up gas as this cools and approaches the nebular equilibrium temperature.
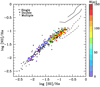 |
Fig. 18 Point-to-point nebular diagnostic diagram for the different types of profiles described in the text. The points for the single profiles are colored according to the distance to R136 shown by the scale on the right. The solid curve shows the low-velocity shock models of Dopita & Sutherland (1996) for a range of velocities between 150 km s−1 and 500 km s−1; two values of the magnetic field density (0 and 1 μG cm−3); and solar abundances. The dashed curve shows the same models scaled to the metallicity of 30 Dor from Pellegrini et al. (2011). |
4.4 The broad unresolved component
Our analysis thus far has ignored the mysterious broad unresolved component that pervades the nebula and that is seen in both the Balmer lines and the forbidden lines of [NII], [SII], and [OIII], precisely because we know nothing of its origin. However, we have seen that like the narrow components, the broad unresolved component of the forbidden lines is narrower than that of Hα, and so it seems reasonable to conjecture that the physical conditions of the gas that emits the broad unresolved lines are similar to those of the nebula as a whole, and therefore that it is probably due to a large collection of fragments of shells and filaments left behind by the cluster wind as it successively breaks out of shells of swept-up material.
We have not explicitly included this component in our estimates of the kinetic energy budget of the nebular gas, for which we used single-Gaussian fits. Although the width of the broad component is large, its residual Hα flux relative to the single-Gaussian fit is negligible, and so we can safely ignore the contribution of the broad component to the kinetic energy budget.
5 Discussion
There is broad disagreement in the literature about the structure of 30Dor and its genesis (Pellegrini et al. 2011; Lopez et al. 2011). Below we present a summary of our own view, which is the result of a series of in-depth investigations of the formation and evolution of super-star clusters and their associated giant HII regions (Silich et al. 2020 and references therein). We then present our interpretation of the observations presented in this paper.
5.1 The genesis of giant HII regions
The progenitors of GHRs are giant molecular clouds (GMCs), which are clumpy and highly turbulent as a consequence of multiple prior generations of star formation, the gravitational field of the parent galaxies, and their own gravitational potential, which is substantial given their large masses (e.g., Heyer & Dame 2015; Krumholz et al. 2019). Even before any stars form, the turbulence within these GMCs is supersonic (with respect to the sound speed of the molecular gas, ~ 1 km s−1), causing the condensations to accrete more molecular material as it cools behind their leading shocks. This sets the initial conditions at the onset of star formation that occurs within the largest and most massive condensations.
The arrival of the most massive stars on the main sequence (MS) produces a sudden ample supply of UV photons that changes the sound speed to ~ 10 km s−1 as the gas becomes photoionized. At the same time, the strong stellar winds from these stars (that reach the MS first) collide with neighboring winds generating multiple shocks that thermalize the winds causing a large overpressure in the star formingvolume, which ends up driving the shocked stellar wind gas as an isotropic supersonic cluster wind (vcw ~ 1000 km s−1) into the surrounding medium (Tenorio-Tagle et al. 2006).
This cluster wind immediately encounters a large number of neighboring condensations, some of them fully or partially ionized, and the interaction leads to another (global) reverse shock that heats up the incoming gas to very high temperatures (T ~ 107 K). The resulting hot gas rapidly expands along multiple paths of least resistance and flows away into lower pressure regions engulfing the dense ionized condensations that were originally part of the parent GMC. The expansion of this continuous wind generates secondary shocks that sweep up the low-density medium between condensations, producing large bubbles and super-bubbles that eventually break up, allowing the hot gas to escape and create the hierarchy of shells, tubes, and filaments that characterize GHRs. The expansion eventually reaches the edge of the GMC and the cluster windescapes into the intergalactic medium carrying with it the products of stellar evolution (Tenorio-Tagle et al. 2006).
5.2 The genesis of 30 Doradus
The morphology of the gas (nebular and X-rays) confirms that the structure of 30 Doradus was carved by the cluster wind and not by the winds of individual stars; the coherent Hα structures that we see are seldom centered on individual stars, if ever. We show in the present paper that the clumpy structure of the X-ray emission is due to shadowing by dense clouds of dust and nebular gas.
The innermost dense regions of the nebular gas have been pushed into coherent structures by the cluster wind in such a way that they form nozzles through which the hot gas flows towards the outer regions of the nebula, creating the giant expanding shells that characterize 30 Doradus. The Chandra X-ray images of Townsley et al. (2006) show regions – notably the large northern plume – where the cluster wind is already escaping from the nebula. The X-ray gas occupies regions of low Hα surface brightness where the profiles are inevitably double, clearly showing that the expanding shells are being “inflated” by the hot cluster wind.
30 Doradus has a clear core–halo structure evidenced mainly by the surface brightness distribution. However, the overall kinematics of the core and the halo are surprisingly similar; the integrated profiles are almost identical and only differ in the broad wings, albeit slightly. This may simply be a coincidence given that the way the cluster winds carve the original molecular cloud must depend on the original configuration, which certainly must vary from one nebula to the next. It would be interesting, however, to verify whether or not other GHRs in the Local Group present similar behavior.
The remnants of the dense clumps of the placental GMC have been piled together by the cluster wind to form the densest parts of the nebular gas, mostly in the form of long twisted filaments. At small scales, the forbidden line-profiles of these shells and filaments are supersonic and composed of many narrower components, which could be due to the detailed hydrodynamics of the expanding shells.
The source of energy for the whole process is therefore the ionizing cluster: the kinematics through the cluster winds and the emission-line luminosity through the ionizing radiation. Ultimately, this explains why L and σ are so tightly related, although it remains hard to explain the steep slope of the L–σ relation. The relation implies that the velocity dispersion of the gas increases very slowly with the mass of the ionizing cluster ( ), and so explaining the L–σ relation remains a challenging problem in astrophysics. Pure gravity would have been much simpler!
6 Summary and conclusions
Theoretical studies predict that the formation and evolution of giant HII regions is determined by hot cluster winds that result from the merging and thermalization of the winds from the individual ionizing stars. Our observations largely support this scenario: none of the large nebular structures that characterize the nebula – with the exception of the central bubble that surrounds R136 – are centered on individual massive stars. The hierarchical structure of the shells, on the other hand, is exactly what is expected from a cluster wind that originates in the core of the ionizing cluster (R136) and breaks out of successive shells built by the material swept up by the same wind.
Here, we confirm previous results that suggest the kinetic energy of the nebular gas is mostly in the form of the expansion of the multiple shells. Not only arethe Hα profiles in the low-surface-brightness regions inside these shells double or multiple, but also the profiles of the rims of these shells, which are mostly single, clearly show organized expansion motions. Expansion accounts for ~ 70% of the kinetic energy while the remainder is manifested by the intrinsic widths of the individual profiles.
The radial dependence of the kinematics and of the Hα surface brightness clearly show a well-defined core–halo structure. The nebular core (R ≤ 25 pc) contains the bulk of the ionizing stars and 23% of the total Hα luminosity. The massive cluster wind that carves the nebular structures originates in the core and is channeled to the external giant expanding bubbles through break-out structures within the core, which act as nozzles.
The clumpiness of the (hot thermalized cluster wind) X-ray-emitting gas is due to shadowing by foreground nebular gas and dust, and so it is reasonable to conclude that the hot gas uniformly fills the nebular core, and is expanding through the break-out nozzles to inflate the characteristic giant (Chu–Kennicutt) external bubbles of 30 Doradus.
The structure function of the turbulence of the nebular gas in 30Dor is flat. The idea that the supersonic turbulence of the gas in giant HII regions is due to a turbulent Kolmogorov-like kinetic energy cascade put forward by Medina-Tanco et al. (1997) can be definitively ruled out. Instead, we find that the structure function of a virialized cluster is more compatible with our observations, albeit only within the cluster core where the velocity dispersion is constant.
The virial mass corresponding to the observed global velocity dispersion of σ30Dor = 23.5 km s−1 and an effective radius of Reff = 25 pc is Mvir = 3.2 × 10⁶ M⊙. The main source of the supersonic velocities observed in the nebular gas is the hot cluster wind, with a small but significant contribution from the gravitational potential of ionized gas, molecular gas, and stars. The total (photometric) mass of 30 Doradus is a few times 105 M⊙ with large uncertainties but certainly less than 106 M⊙.
Acknowledgements
Part of this work was done during the 24th Guillermo Haro Workshop at INAOE We are grateful to the organizers of the meeting and to INAOE for creating and maintaining this unique venue. We thank Sverre Aarseth for providing his N-body simulation of a virialized cluster and Gustavo Medina-Tanco for sharing with us the Taurus-II radial velocities of NGC 604. We also thank the PI’s of the observing programs that spawned the treasure trove of data that we have used in this paper, and ESO for making these data reduced and readily available through its Phase3 archive. In particular, we thank Reinhard Hanuschik for helping us understand some subtleties of the pipe-line reductions of FLAMES/GIRAFFE data. JM acknowledges the hospitality of ON and INAOE where parts of this paper were written. This research has made use of “Aladin sky atlas” developed at CDS, Strasbourg Observatory, France.
Appendix A Geometrical effects related to radial gradients in the strength of the forbidden lines
The strength of the forbidden lines is inversely proportional to the electron density Ne, which decreases with radius roughly as Ne ∝ R−0.7 as shown in Fig. A.1.
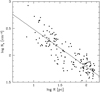 |
Fig. A.1 Logarithmic plot of the electron density derived from the [SII] doublet as a function of radius. The line shows a least-squares fit of slope −0.7. |
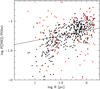 |
Fig. A.2 Ratio of the flux of [NII]678.3 to Hα as a function of radius (shown by black points). The red points correspond to [SII]/Hα. |
The flux of ionizing radiation should decrease roughly as Nν ∝ R−2 because a large fraction of the ionizing stars are concentrated at the center of the ionizing cluster (R136). However, not all ionizing stars are in R136 (Castro et al. 2018), and so it is safer to assume that Nν ∝ R−α where α measures the central concentration of the ionizing flux. Thus, the ratio of [NII]/Hα scales as Rα−0.7.
Figure A.2 plots this ratio as a function of radius for the single profiles. The least-squares fit shows that F([NII]∕F(Hα) ~ R0.2 in the halo and ~R0.7 in the nebular core (we used only [NII] that has more points). This indicates that α = 1.4 in the core and α = 0.9 in the halo. As an exercise, keen readers can compare these predictions with the observed distribution of massive stars using the catalog of 30Dor stars (Castro et al. 2018).
In principle, one could therefore expect the difference between the widths of [NII] and Hα to depend on radius, but this is not the case. Figure A.3 plots the difference in the widths of [NII] and Hα for the single lines in our sample. We observe no obvious trend. We therefore exclude that the Hα lines are broader due to geometrical effects where [NII] (and [SII]) probe mostly the kinematics of nebular halo whereas Hα probes the entire nebula.
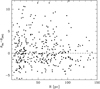 |
Fig. A.3 Difference between the rms widths of the individual [NII] and Hα profiles. |
Appendix B Neutral and molecular gas in 30 Doradus
We refer to the work of Ochsendorf et al. (2017) for a recent review of the gas content of 30Dor. The HI mass estimated by Ochsendorf et al. (2017) using the 21 cm data of Kim et al. (1999) increases as M ~ R2 as expected for a uniform constant surface density sheet of HI extending out to at least 250pc from R136. On the other hand, the profiles of H2 and HII reach a plateau at R ~ 30 pc. Unfortunately, the list of 21 cm LMC sources of Kim et al. (1999) inexplicably misses GS78, which corresponds to 30Dor, so we are not able to check whether the HI-sheet has the same radial velocity as the Hα emission. Therefore, we have taken the view that 30Dor does not contain significant neutral hydrogen, certainly not in the core.
However, there is a GMC, namely 30Dor-10, projected at a distance of 15–30 pc north of R136 (illustrated by the yellow contour in Fig. 13. ALMA high-resolution observations (Indebetouw et al. 2013) give a total mass of  M⊙ for 30Dor-10, but Chevance et al. (2020) argue that most of the molecular gas in that region may be “CO-dark”. Using IR observations and a PDR model, they derive an H2 mass of 1.8 × 10⁵ M⊙.
We discussed in the main text how the patchiness of the X-ray emission is due to obscuration by nebular gas and dust, but we did not include an image of dust emission in order to avoid crowding the nebular features. Figure B.1 shows the two views from Fig. 13 plus a third panel showing the dust emission from Spitzer. The GMC 30Dor-10 is shown in green, while as before, the red and blue dots represent blueshifted and redshifted nebular Hα. The average radial velocity of 30Dor-10 is  km s−13 indicating that it is either in front of R136, and being expelled from the nebular core by radiation pressure, or behind and infalling towards R136.
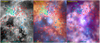 |
Fig. B.1 Left: WFI Hα image of 30Dor. Center: composite image from Townsley et al. (2006). The IR emission from Spitzer is shown in orange and the X-ray emission in blue. Right: Chandra 20-yr anniversary three-channel X-ray image of the same region. The images have been astrometrically matched using point-like X-ray sources and the software package Aladin (Bonnarel et al. 2000). The Chandra image is rotated ~ 15° clockwise relative to the others due to the incompetence of the lead author (J.M.) in dealing with Aladin. As in Fig. 13 in the main text, the red and blue dots show the positions of red and blue shifted single profiles; the green open rhombs mark positions of the CO clumps identified by Indebetouw et al. (2013) in their ALMA data for the giant molecular cloud 30Dor-10. |
The fact that 30Dor-10 is located exactly on top of a dark patch in the X-ray image suggests that the cloud is in front of, and obscures, the hot gas. However, the cloud also overlaps with one of the dustiest regions of 30Dor seen by Spitzer, which is also quite luminous in Hα. The nebular gas in that region is also blueshifted, but the radial velocities do not match those of the GMC. Opposite 30Dor-10, to the south of R136, there is a similarly luminous dust-emission and Hα region, which however does not contain (significant) molecular gas. Therefore, it is reasonable to assume that most of the dust emission seen in the Spitzer image (including the region of 30Dor-10) that obscures the X-ray emission comes from nebular dust and not from dust associated with the GMC, and therefore that 30Dor-10 is in reality falling towards R136.
If that is the case, the PDR models of Chevance et al. (2020), which explicitly assume that dust is associated with the molecular cloud, are inaccurate, and the corresponding mass determinations are at best upper limits. The same is true for the H2 masses that these latter authors derived from modeling the dust. As a corollary, the discrepancy between the molecular mass from PDR modeling and the CO masses of Indebetouw et al. (2013) is probably not as large as Chevance et al. (2020) claim.
With the caveats above, Chevance et al. (2020) estimate that the GMC stretches roughly radially between 20 pc and 80 pc from R136 and so only a fraction of the cloud would lie within the kinematical core (R ≤ 25 pc). We therefore assume that core contains at most half of the H2 mass of 30Dor-10, that is, 9 × 10⁴ M⊙.
References
- Arthur, S. J., Medina, S. N. X., & Henney, W. J. 2016, MNRAS, 463, 2864 [Google Scholar]
- Bastian, N., Covey, K. R., & Meyer, M. R. 2010, ARA&A, 48, 339 [NASA ADS] [CrossRef] [Google Scholar]
- Bonnarel, F., Fernique, P., Bienaymé, O., et al. 2000, A&AS, 143, 33 [NASA ADS] [CrossRef] [EDP Sciences] [Google Scholar]
- Bosch, G., Selman, F., Melnick, J., & Terlevich, R. 2001, A&A, 380, 137 [NASA ADS] [CrossRef] [EDP Sciences] [Google Scholar]
- Bosch, G., Terlevich, E., & Terlevich, R. 2009, AJ, 137, 3437 [NASA ADS] [CrossRef] [Google Scholar]
- Castro, N., Crowther, P. A., Evans, C. J., et al. 2018, A&A, 614, A147 [NASA ADS] [CrossRef] [EDP Sciences] [Google Scholar]
- Chevance, M., Madden, S. C., Fischer, C., et al. 2020, MNRAS, 494, 5279 [CrossRef] [Google Scholar]
- Chu, Y.-H., & Kennicutt, Robert C., J. 1994, ApJ, 425, 720 [NASA ADS] [CrossRef] [Google Scholar]
- Dopita, M. A., & Sutherland, R. S. 1996, ApJS, 102, 161 [NASA ADS] [CrossRef] [Google Scholar]
- Doran, E. I., Crowther, P. A., de Koter, A., et al. 2013, A&A, 558, A134 [NASA ADS] [CrossRef] [EDP Sciences] [Google Scholar]
- Evans, C. J., Taylor, W. D., Hénault-Brunet, V., et al. 2011, A&A, 530, A108 [NASA ADS] [CrossRef] [EDP Sciences] [Google Scholar]
- Feast, M. W. 1961, MNRAS, 122, 1 [NASA ADS] [CrossRef] [Google Scholar]
- Fernández Arenas, D., Terlevich, E., Terlevich, R., et al. 2018, MNRAS, 474, 1250 [NASA ADS] [CrossRef] [Google Scholar]
- García-Díaz, M. T., Henney, W. J., López, J. A., & Doi, T. 2008, Rev. Mex. Astron. Astrofis., 44, 181 [NASA ADS] [Google Scholar]
- Hénault-Brunet, V., Evans, C. J., Sana, H., et al. 2012a, A&A, 546, A73 [NASA ADS] [CrossRef] [EDP Sciences] [Google Scholar]
- Hénault-Brunet, V., Gieles, M., Evans, C. J., et al. 2012b, A&A, 545, A1 [NASA ADS] [CrossRef] [EDP Sciences] [Google Scholar]
- Heyer, M., & Dame, T. M. 2015, ARA&A, 53, 583 [NASA ADS] [CrossRef] [Google Scholar]
- Hippelein, H. H. 1986, A&A, 160, 374 [NASA ADS] [Google Scholar]
- Indebetouw, R., Brogan, C., Chen, C. H. R., et al. 2013, ApJ, 774, 73 [Google Scholar]
- Kim, S., Dopita, M. A., Staveley-Smith, L., & Bessell, M. S. 1999, AJ, 118, 2797 [NASA ADS] [CrossRef] [Google Scholar]
- Krumholz, M. R., McKee, C. F., & Bland -Hawthorn, J. 2019, ARA&A, 57, 227 [NASA ADS] [CrossRef] [Google Scholar]
- Lopez, L. A., Krumholz, M. R., Bolatto, A. D., Prochaska, J. X., & Ramirez-Ruiz, E. 2011, ApJ, 731, 91 [NASA ADS] [CrossRef] [Google Scholar]
- Medina-Tanco, G. A., Sabalisck, N., Jatenco-Pereira, V., & Opher, R. 1997, ApJ, 487, 163 [NASA ADS] [CrossRef] [Google Scholar]
- Melnick, J. 1977, PhD thesis, California Institute of Technology [Google Scholar]
- Melnick, J., Moles, M., Terlevich, R., & Garcia-Pelayo, J.-M. 1987, MNRAS, 226, 849 [NASA ADS] [CrossRef] [Google Scholar]
- Melnick, J., Tenorio-Tagle, G., & Terlevich, R. 1999, MNRAS, 302, 677 [NASA ADS] [CrossRef] [Google Scholar]
- Melnick, J., Telles, E., Bordalo, V., et al. 2017, A&A, 599, A76 [NASA ADS] [CrossRef] [EDP Sciences] [Google Scholar]
- Muñoz-Tuñón, C., Tenorio-Tagle, G., Castañeda, H. O., & Terlevich, R. 1996, AJ, 112, 1636 [NASA ADS] [CrossRef] [Google Scholar]
- Ochsendorf, B. B., Zinnecker, H., Nayak, O., et al. 2017, Nat. Astron., 1, 784 [NASA ADS] [CrossRef] [Google Scholar]
- Pellegrini, E. W., Baldwin, J. A., & Ferland, G. J. 2011, ApJ, 738, 34 [Google Scholar]
- Sabalisck, N. S. P., Tenorio-Tagle, G., Castaneda, H. O., & Munoz-Tunon, C. 1995, ApJ, 444, 200 [NASA ADS] [CrossRef] [Google Scholar]
- Selman, F., Melnick, J., Bosch, G., & Terlevich, R. 1999, A&A, 347, 532 [NASA ADS] [Google Scholar]
- Silich, S., Tenorio-Tagle, G., Martínez-González, S., & Turner, J. 2020, MNRAS, 494, 97 [Google Scholar]
- Smith, M. G., & Weedman, D. W. 1972, ApJ, 172, 307 [NASA ADS] [CrossRef] [Google Scholar]
- Tenorio-Tagle, G., Muñoz-Tuñón, C., Pérez, E., Silich, S., & Telles, E. 2006, ApJ, 643, 186 [NASA ADS] [CrossRef] [Google Scholar]
- Torres-Flores, S., Barbá, R., Maíz Apellániz, J., et al. 2013, A&A, 555, A60 [NASA ADS] [CrossRef] [EDP Sciences] [Google Scholar]
- Townsley, L. K., Broos, P. S., Feigelson, E. D., et al. 2006, AJ, 131, 2140 [NASA ADS] [CrossRef] [Google Scholar]
- Yang, H., Chu, Y.-H., Skillman, E. D., & Terlevich, R. 1996, AJ, 112, 146 [NASA ADS] [CrossRef] [Google Scholar]
All Tables
All Figures
|
Fig. 1 L–σ relation for GHRs adapted from Fernández Arenas et al. (2018). |
| In the text | |
|
Fig. 2 Top: integrated Hα profile of 30 Doradus using all the available data (1668 points). Two Gaussian components are required to fit the core and the wings of the line shown by the thin red lines. The data are shown asblue points and the sum of the two Gaussians by the red dashed lines. The legend reports the measured (left) and corrected for instrumental and thermal broadening (right) widths (σ) of each component plus the width from a single Gaussian fit (σ0 shown by the black lines). Bottom: same as top, but using only 879 points from the uniform grid of Torres-Flores et al. (2013). The heliocentric radial velocity of 30Dor obtained from the full sample is V30Dor = 264.8 km s−1 for an Hα rest wavelength of 656.2804 nm. |
| In the text | |
|
Fig. 3 Integrated profiles of the core of 30Dor (r < 40 pc) and seven radial bins identified in the figure legend, which quotes the inner and outer radii of each ring in parsecs. The legend also provides the widths of the multi-Gaussian fits of each ring (right) and the width and radial velocity, denoted as 0, of the single Gaussian fit (that is not plotted) relative to the integrated velocity of the nebular core (left), which defines our rest frame for 30Dor. |
| In the text | |
|
Fig. 4 Cartoon illustrating the three typical shapes of our 1668 profiles. The intensity ratios of the double and multiple components vary widely as discussed in the text. The purple lines show single Gaussian fits to the particular profiles illustrated in the cartoons. |
| In the text | |
|
Fig. 5 Profile shapes of Hα are generally different from those of the forbidden lines. The vertical dashed lines correspond to the wavelengths at the heliocentric radial velocity of 30Dor from the sum of the single Hα profiles V30Dor = 265.4 km s−1. |
| In the text | |
|
Fig. 6 Distribution of radial velocities relative to the rest frame of 30Dor of the two components of the double profiles. P1 (magenta) represents the component with highest peak intensity and P2 (green) the weaker component. |
| In the text | |
|
Fig. 7 Public Hα image of 30Dor taken with the Wide Field Imager on the 2.2 m telescope of La Silla. The dots and crosses show the positions of the three families of profiles discussed in the text, color-coded as follows: blue for blueshifted single profiles; red redshifted single profiles; yellow crosses double profiles; and cyan dots multiple profiles. The red and blue dots with white rims have radial velocities close to zero (|V | < 2.5 km s−1). The lower-right corner (SW) of the image portrays the slow expanding shell of the supernova remnant 30DorB. The scale shown in the lower-left corner corresponds to 15 pc. |
| In the text | |
|
Fig. 8 Left: stacked [NII] single profiles rebinned to zero redshift using a wavelength of 656.2804 for Hα. The red lines show the three Gaussian components necessary to fit the data. The blue dots show the data, and the black line the overall fit. The legends give the observed width of each component(top left), and the widths corrected for instrumental and thermal broadening (top right). σ0 corresponds to a single-Gaussian fit. Right: stack of Hα profiles. |
| In the text | |
|
Fig. 9 HARPS spectrum of the center of 30 Doradus (R136) showing the broad features of the massive WN7h stars in the core of its ionizing cluster. The insert shows the nebular Hβ line superposed on the broad absorption trough of the stellar component. |
| In the text | |
|
Fig. 10 Nebular line profiles at the two positions observed with HARPS. Hα profiles in the bottom panels and [OIII]5007 in the top panels. The multi-Gaussian fit components are plotted in red and the solid black line shows the overall fit. |
| In the text | |
|
Fig. 11 Radial Hα brightness profile of 30Dor obtained by integrating the flux in incremental rings of 1pc. The dashed line shows the radius, r = 25 pc, where the kinematics shown in Fig. 3 shows a distinct inflection point. |
| In the text | |
|
Fig. 12 Comparison between the integrated Hα profiles of the whole nebula (bottom) and the profile of the kinematical core (r ≤ 25 pc) and that of the kinematical halo (r > 25 pc). The blue points are the data and the thick-dashed red line is the fit of two Gaussian components shown in thin red. The single-Gaussian fit is shown by the black line. The parameters of these components, observed and corrected for instrumental and thermal broadening, are shown in the legend. |
| In the text | |
|
Fig. 13 Left: central 60 pc of 30 Doradus in Hα using a public domain image taken with the 2.2 m/WFI imager on La Silla. North is upwards; East is to the left. Right: Chandra 20-year anniversary X-ray image of the same region (credit: NASA/CXC/Penn State Univ./L. Townsley et al.). The two images have been astrometrically matched using point-like X-ray sources and the software package Aladin (Bonnarel et al. 2000). The cross near the center shows R136, the core of the ionizing cluster (the second cross on the X-ray image shows one of the astrometric references). The red and blue dots show the positions of red- and blueshifted single profiles relative to the systemic velocity of 30Dor, V30Dor = 265.4 km s−1. The orange crosses mark positions where the profiles are double and the green dots show the positions of the multiple (mostly triple) profiles. The yellow line draws the contours of the giant molecular cloud 30Dor-10 (Indebetouw et al. 2013). |
| In the text | |
|
Fig. 14 Structure function of the central region of NGC 604 using the same radial-velocity data from Medina-Tanco et al. (1997). The red bar shows the radius (4.1 pc) corresponding to the seeing disk (1″) of the TAURUS-II observations used to construct the structure function. |
| In the text | |
|
Fig. 15 Normalized structure function of 30 Doradus. Top: using the radial velocities of the strongest peak of each profile. Mid: radial velocities measured from single-Gaussian fits. Bottom: using only profiles classified as single. |
| In the text | |
|
Fig. 16 Structure function of a virialized cluster of 2000 particles. All particles have equal mass and the total mass of the cluster is 103M⊙. For a virialized system S2(r) ≃ 2σ2 and the velocity dispersion σ is constant in the core. |
| In the text | |
|
Fig. 17 Velocity dispersion as a function of radius from the single profiles. The red points and line show the radial-velocity dispersion of the profile centroids and the blue points show the average width of the profiles in each radial bin. The horizontal error bars show the size of the bins, and the vertical bars show the rms dispersions of the average widths. |
| In the text | |
|
Fig. 18 Point-to-point nebular diagnostic diagram for the different types of profiles described in the text. The points for the single profiles are colored according to the distance to R136 shown by the scale on the right. The solid curve shows the low-velocity shock models of Dopita & Sutherland (1996) for a range of velocities between 150 km s−1 and 500 km s−1; two values of the magnetic field density (0 and 1 μG cm−3); and solar abundances. The dashed curve shows the same models scaled to the metallicity of 30 Dor from Pellegrini et al. (2011). |
| In the text | |
|
Fig. A.1 Logarithmic plot of the electron density derived from the [SII] doublet as a function of radius. The line shows a least-squares fit of slope −0.7. |
| In the text | |
|
Fig. A.2 Ratio of the flux of [NII]678.3 to Hα as a function of radius (shown by black points). The red points correspond to [SII]/Hα. |
| In the text | |
|
Fig. A.3 Difference between the rms widths of the individual [NII] and Hα profiles. |
| In the text | |
|
Fig. B.1 Left: WFI Hα image of 30Dor. Center: composite image from Townsley et al. (2006). The IR emission from Spitzer is shown in orange and the X-ray emission in blue. Right: Chandra 20-yr anniversary three-channel X-ray image of the same region. The images have been astrometrically matched using point-like X-ray sources and the software package Aladin (Bonnarel et al. 2000). The Chandra image is rotated ~ 15° clockwise relative to the others due to the incompetence of the lead author (J.M.) in dealing with Aladin. As in Fig. 13 in the main text, the red and blue dots show the positions of red and blue shifted single profiles; the green open rhombs mark positions of the CO clumps identified by Indebetouw et al. (2013) in their ALMA data for the giant molecular cloud 30Dor-10. |
| In the text | |
Current usage metrics show cumulative count of Article Views (full-text article views including HTML views, PDF and ePub downloads, according to the available data) and Abstracts Views on Vision4Press platform.
Data correspond to usage on the plateform after 2015. The current usage metrics is available 48-96 hours after online publication and is updated daily on week days.
Initial download of the metrics may take a while.