Free Access
Fig. 4
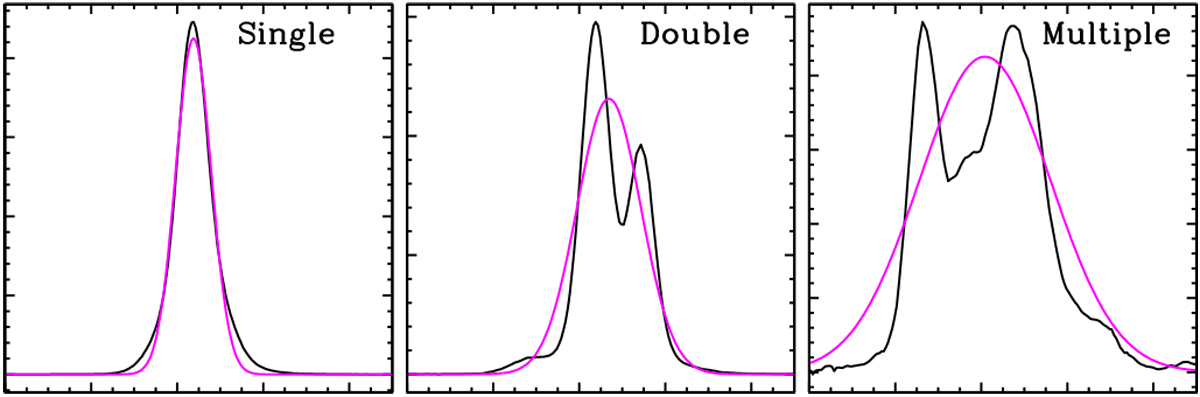
Cartoon illustrating the three typical shapes of our 1668 profiles. The intensity ratios of the double and multiple components vary widely as discussed in the text. The purple lines show single Gaussian fits to the particular profiles illustrated in the cartoons.
Current usage metrics show cumulative count of Article Views (full-text article views including HTML views, PDF and ePub downloads, according to the available data) and Abstracts Views on Vision4Press platform.
Data correspond to usage on the plateform after 2015. The current usage metrics is available 48-96 hours after online publication and is updated daily on week days.
Initial download of the metrics may take a while.