Fig. 18
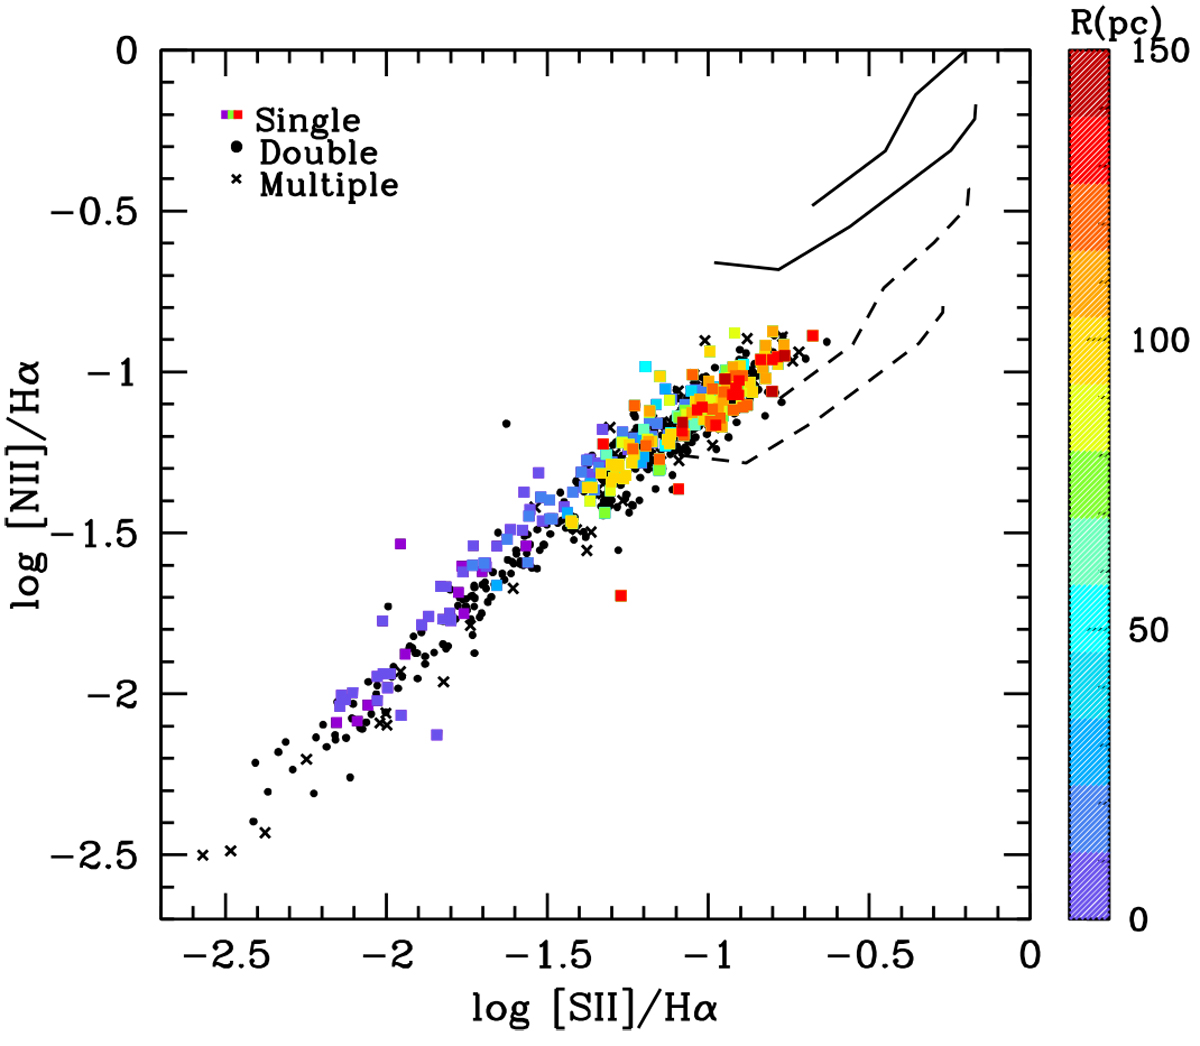
Point-to-point nebular diagnostic diagram for the different types of profiles described in the text. The points for the single profiles are colored according to the distance to R136 shown by the scale on the right. The solid curve shows the low-velocity shock models of Dopita & Sutherland (1996) for a range of velocities between 150 km s−1 and 500 km s−1; two values of the magnetic field density (0 and 1 μG cm−3); and solar abundances. The dashed curve shows the same models scaled to the metallicity of 30 Dor from Pellegrini et al. (2011).
Current usage metrics show cumulative count of Article Views (full-text article views including HTML views, PDF and ePub downloads, according to the available data) and Abstracts Views on Vision4Press platform.
Data correspond to usage on the plateform after 2015. The current usage metrics is available 48-96 hours after online publication and is updated daily on week days.
Initial download of the metrics may take a while.