Fig. 13
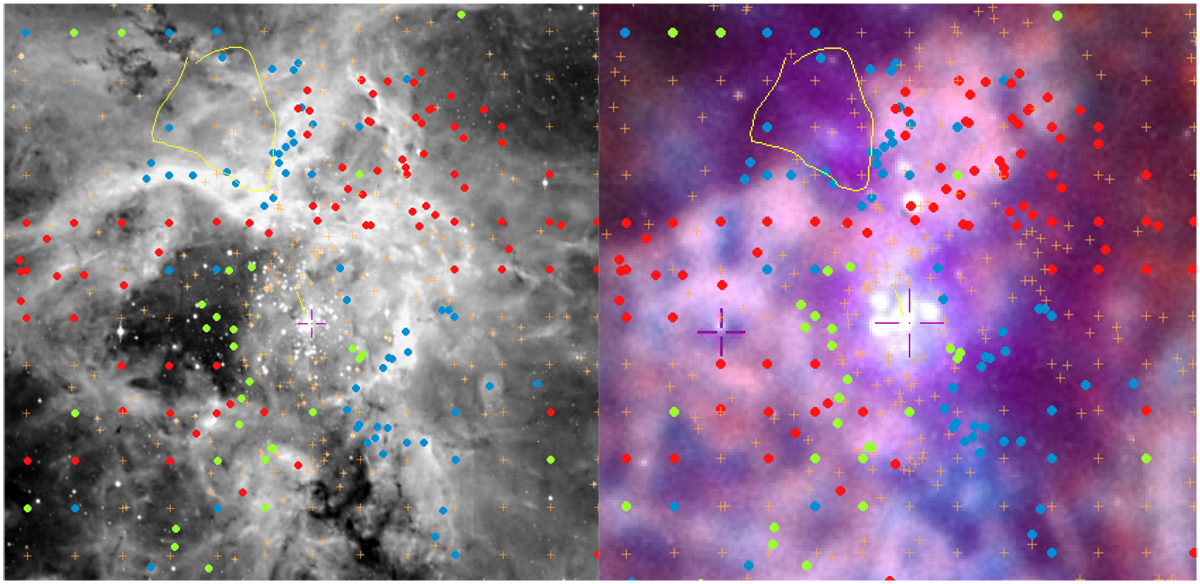
Left: central 60 pc of 30 Doradus in Hα using a public domain image taken with the 2.2 m/WFI imager on La Silla. North is upwards; East is to the left. Right: Chandra 20-year anniversary X-ray image of the same region (credit: NASA/CXC/Penn State Univ./L. Townsley et al.). The two images have been astrometrically matched using point-like X-ray sources and the software package Aladin (Bonnarel et al. 2000). The cross near the center shows R136, the core of the ionizing cluster (the second cross on the X-ray image shows one of the astrometric references). The red and blue dots show the positions of red- and blueshifted single profiles relative to the systemic velocity of 30Dor, V30Dor = 265.4 km s−1. The orange crosses mark positions where the profiles are double and the green dots show the positions of the multiple (mostly triple) profiles. The yellow line draws the contours of the giant molecular cloud 30Dor-10 (Indebetouw et al. 2013).
Current usage metrics show cumulative count of Article Views (full-text article views including HTML views, PDF and ePub downloads, according to the available data) and Abstracts Views on Vision4Press platform.
Data correspond to usage on the plateform after 2015. The current usage metrics is available 48-96 hours after online publication and is updated daily on week days.
Initial download of the metrics may take a while.