Free Access
Fig. 10
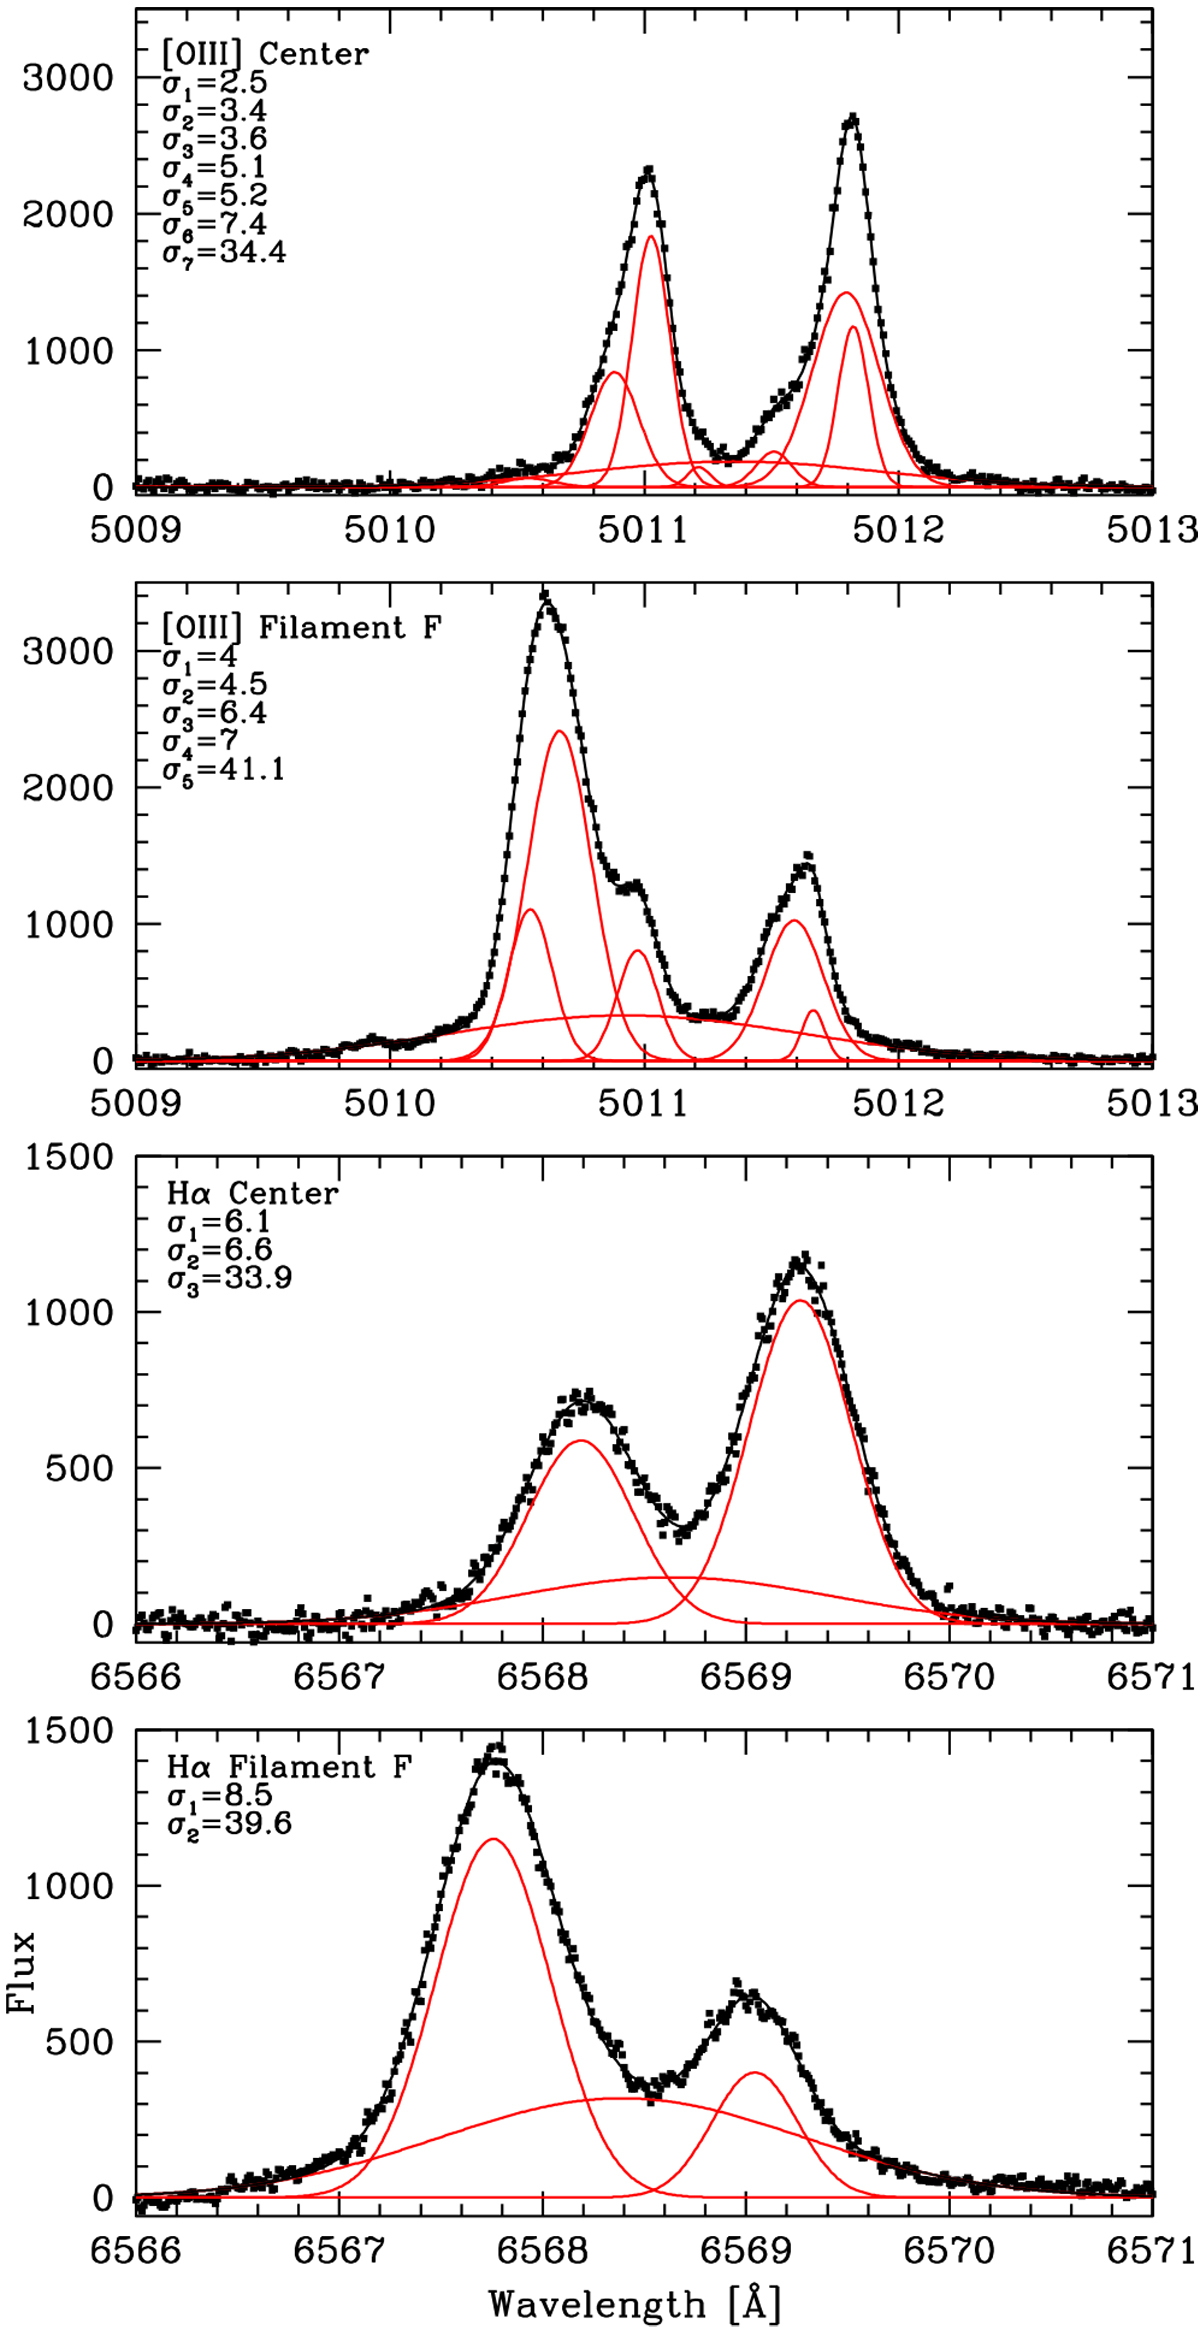
Nebular line profiles at the two positions observed with HARPS. Hα profiles in the bottom panels and [OIII]5007 in the top panels. The multi-Gaussian fit components are plotted in red and the solid black line shows the overall fit.
Current usage metrics show cumulative count of Article Views (full-text article views including HTML views, PDF and ePub downloads, according to the available data) and Abstracts Views on Vision4Press platform.
Data correspond to usage on the plateform after 2015. The current usage metrics is available 48-96 hours after online publication and is updated daily on week days.
Initial download of the metrics may take a while.