Fig. B.1
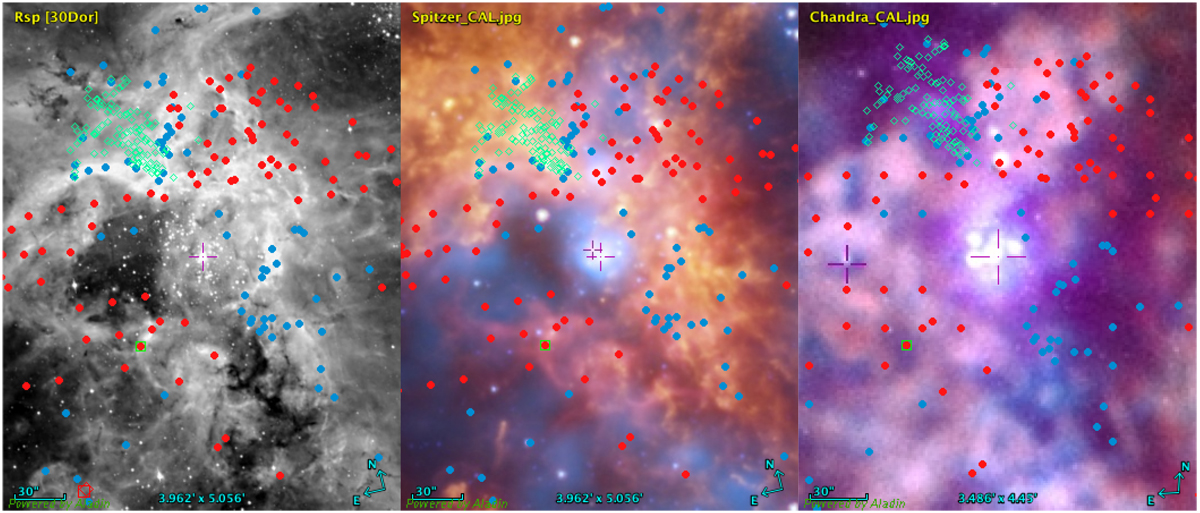
Left: WFI Hα image of 30Dor. Center: composite image from Townsley et al. (2006). The IR emission from Spitzer is shown in orange and the X-ray emission in blue. Right: Chandra 20-yr anniversary three-channel X-ray image of the same region. The images have been astrometrically matched using point-like X-ray sources and the software package Aladin (Bonnarel et al. 2000). The Chandra image is rotated ~ 15° clockwise relative to the others due to the incompetence of the lead author (J.M.) in dealing with Aladin. As in Fig. 13 in the main text, the red and blue dots show the positions of red and blue shifted single profiles; the green open rhombs mark positions of the CO clumps identified by Indebetouw et al. (2013) in their ALMA data for the giant molecular cloud 30Dor-10.
Current usage metrics show cumulative count of Article Views (full-text article views including HTML views, PDF and ePub downloads, according to the available data) and Abstracts Views on Vision4Press platform.
Data correspond to usage on the plateform after 2015. The current usage metrics is available 48-96 hours after online publication and is updated daily on week days.
Initial download of the metrics may take a while.