| Issue |
A&A
Volume 632, December 2019
|
|
|---|---|---|
| Article Number | A29 | |
| Number of page(s) | 9 | |
| Section | Interstellar and circumstellar matter | |
| DOI | https://doi.org/10.1051/0004-6361/201936119 | |
| Published online | 22 November 2019 | |
Search for H3+ isotopologues toward CRL 2136 IRS 1★,★★,★★★
1
Universitäts-Sternwarte München, Ludwig-Maximilians-Universität,
Scheinerstr. 1,
81679 München,
Germany
e-mail: mgoto@usm.lmu.de
2
Gemini Observatory,
670 North Aòhoku Place,
Hilo,
HI 96720,
USA
3
Department of Physics, 00014 University of Helsinki, PO Box 64,
Finland
4
Max-Planck-Institut für extraterrestrische Physik,
Giessenbachstrasse 1,
85748
Garching,
Germany
5
Max-Planck-Institut für Radioastronomie,
Auf dem Hügel 69,
53121 Bonn,
Germany
6
Thirty Meter Telescope Japan, National Astronomical Observatory of Japan,
Osawa 2-21-1,
Mitaka,
Tokyo
181-8588,
Japan
Received:
17
June
2019
Accepted:
31
August
2019
Context. Deuterated interstellar molecules frequently have abundances relative to their main isotopologues much higher than the overall elemental D-to-H ratio in the cold dense interstellar medium. H3+ and its isotopologues play a key role in the deuterium fractionation; however, the abundances of these isotopologues have not been measured empirically with respect to H3+ to date.
Aims. Our aim was to constrain the relative abundances of H2D+ and D3+ in the cold outer envelope of the hot core CRL 2136 IRS 1.
Methods. We carried out three observations targeting H3+ and its isotopologues using the spectrographs CRIRES at the VLT, iSHELL at IRTF, and EXES on board SOFIA. In addition, the CO overtone band at 2.3 μm was observed by iSHELL to characterize the gas on the line of sight.
Results. The H3+ ion was detected toward CRL 2136 IRS 1 as in previous observations. Spectroscopy of lines of H2D+ and D3+ resulted in non-detections. The 3σ upper limits of N(H2D+)/N(H3+) and N(D3+)/N(H3+) are 0.24 and 0.13, respectively. The population diagram for CO is reproduced by two components of warm gas with the temperatures 58 and 530 K, assuming a local thermodynamic equilibrium (LTE) distribution of the rotational levels. Cold gas (<20 K) makes only a minor contribution to the CO molecular column toward CRL 2136 IRS 1.
Conclusions. The critical conditions for deuterium fractionation in a dense cloud are low temperature and CO depletion. Given the revised cloud properties, it is no surprise that H3+ isotopologues are not detected toward CRL 2136 IRS 1. The result is consistent with our current understanding of how deuterium fractionation proceeds.
Key words: astrochemistry / ISM: molecules / ISM: clouds / stars: individual: CRL 2136 IRS 1 / ISM: lines and bands / infrared: ISM
Based on data collected in CRIRES DDT program [289.C-5042] at the VLT on Cerro Paranal (Chile), which is operated by the European Southern Observatory (ESO).
Based on data collected by iSHELL at the Infrared Telescope Facility, which is operated by the University of Hawaii under contract NNH14CK55B with the National Aeronautics and Space Administration.
Based on observations made with the NASA/DLR Stratospheric Observatory for Infrared Astronomy (SOFIA). SOFIA is jointly operated by the Universities Space Research Association, Inc. (USRA), under NASA contract NNA17BF53C, and the Deutsches SOFIA Institut (DSI) under DLR contract 50 OK 0901 to the University of Stuttgart.
© ESO 2019
1 Introduction
Most neutral-neutral chemical reactions, familiar in the laboratory, do not occur in cold interstellar clouds because of the high reaction barriers they have relative to the kinetic energies of molecules and atoms in the cloud. Instead, ion-neutral reactions drive interstellar gas-phase chemistry, since they proceed with temperature-independent high Langevin rates. The molecular ion H forms as a consequence of cosmic ray ionization of H2, which is the most abundant molecule in the Universe, and initiates much of this ion-neutral chemistry (for a review, see Oka 2013).
Deuterium (2H), an isotope of hydrogen, formed in the first 20 min after the Big Bang (for a review, see Steigman 2007). Its overall abundance has been decreasing gradually, due to nuclear burning inside of stars. The abundance of deuterium relative to 1H in the local interstellar medium has declined from its initial value of 3 × 10⁻⁵ to the present value of 1.5 × 10⁻⁵ (Linsky et al. 2006). Initially it was a big surprise when DCN, an isotopologue of HCN, was found by Jefferts et al. (1973) in the Orion Nebula, with an abundance relative to HCN close to that of HC15 N (1/300), implying 200 times more D in the DCN than expected based only on the elemental abundance of D/H. The high abundance of DCN was soon explained by Watson (1973) as a result of the reaction of H with HD,
 (1)
(1)
which is exothermic by 232 K (Amano & Watson 1984) when the reactants and the products are all in their ground states. In a cold interstellar cloud, the thermodynamical equilibrium factor, exp (−232 K∕10 K) ~ 10−10, more than compensates for the low D/H ratio (Roueff et al. 2007). H2 D+ works in the same way as H in the chemical network of the cold dense interstellar medium, distributing its D among more massive and more complex molecules. The subsequent reactions of the first and second isotopologues, H2 D+ and D2 H+, with HD are both exothermic as well. In the case that the most favored conditions align, D
 can be the most abundant H
 isotopologue in the interstellar medium (Roberts et al. 2003; Sipilä et al. 2010).
The isotopologues H2 D+ and D2 H+ have been detected in cold dark clouds via their pure rotational transitions (Caselli et al. 2003, 2008; Vastel et al. 2004; Harju et al. 2017). Their high abundances are consistent with reaction (1). For the enrichment of D2 H+, a similar exothermic reaction with (1), H2D+ + HD →D2H+ + H2 is responsible. For a few sightlines where H2 D+ and D2 H+ are both observed, [D2 H+]/[H2D+] even exceeds unity (e.g., L 1688; Parise et al. 2011). Submillimeter spectroscopy of H2 D+ and D2 H+ is now a critical tool for the chemical dating of clouds, and is used to calibrate their dynamical evolution (e.g., Brünken et al. 2014; Harju et al. 2017).
In contrast, H and D
and D do not have permanent electric dipole moment; therefore, their rotational transitions are forbidden. In order to measure their column densities, it is necessary to employ infrared spectroscopy (Flower et al. 2004) to observe the ro-vibrational transitions in absorption, which requires bright infrared background sources (Geballe & Oka 2010; Geballe et al. 2019). As bright infrared sources are often in clouds that are warmer than the cold clouds in which H2D+ and D2 H+ have been found, to date there has been no overlap of the observations where both H
 and its deuterated isotopologues have been detected.
This paper reports on a search for isotopologues of H toward CRL 2136 IRS 1, one of the two sightlines where H
 was initially discovered in the interstellar medium (Geballe & Oka 1996). CRL 2136 IRS 1 is a young high-mass star with a warm envelope (250–580 K; Mitchell et al. 1990; Goto et al. 2013; Indriolo et al. 2013). Mitchell et al. (1990) also concluded that the line of sight passes through a cloud of temperature 17 K. This cold foreground component is the primary target of the present investigation.
In addition to the search for H isotopologues, we used spectroscopy of the CO vibrational first overtone band at 2.3 μm to re-characterize the temperature distribution of the molecular gas on the line of sight, last done three decades ago with the fundamental band (Mitchell et al. 1990). The use of lines in the overtone band has a number of advantages over lines in other CO bands. Many of its lines are packed in a narrow wavelength interval, 2.3–2.4 μm (40 lines in the present case), and can often be recorded simultaneously. This allows more quantitative diagnostics of the clouds compared to what would be possible with a few submillimeter transitions. The overtone lines are much less optically thick than the rotational emission lines, and also less thick than the fundamental vibration-rotation transitions at 4.7 μm. Since CO v = 2–0 lines are observed in absorption, the cloud in question is strictly in the foreground, which makes the interpretation of the line kinematics straightforward.
2 Observations
2.1 H v = 1−0 by CRIRES
The observation targeted the fortuitous doublet of the vibrational-rotation lines originating in the two lowest rotational levels, R(1,1)u [para-H ] and R(1,0) [ortho-H
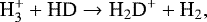
 ] at 3.668 μm, and two transitions from the excited levels, R(3,3)l and R(2,2)l at 3.5336 and 3.6205 μm, respectively. The R(3,3)l and R(2,2)l lines have been detected to date only in the warm diffuse and dense interstellar gas in the few hundred parsec-sized central molecular zone (CMZ) around the Galactic center (Oka et al. 2019; Goto et al. 2002, 2011, 2014). The observation was carried out on 2012 September 16 UT using the CRyogenic InfraRed Echelle Spectrograph (CRIRES; Kaeufl et al. 2004) at the Very Large Telescope (VLT) in Paranal, Chile. The slit width was 0.′′4, providing a spectral resolving power of R = 50 000. The position angle of the slit was set to 45° in order to avoid possible contamination by extended infrared emission near CRL 2136 IRS 1 (Murakawa et al. 2008). The integration times were 180 s for each grating setting. An early-type star HR 6879 (B9.5 III) was observed after the science observations.
The data were reduced on the esorex platform using CRIRES pipeline recipes up to the extraction of the one-dimensional spectra. A custom IDL code was then used to remove the absorption of the telluric lines by dividing the object spectra by those of the spectroscopic standard star. Wavelength calibration was performed at the same time, referring to the synthetic atmospheric transmission curve computed by ATRAN (Lord 1992), and converted to the velocity with respect to the local standard of rest (LSR). The results are shown in Fig. 1.
2.2 H2D+ v = 1−0, H v = 1−0, and CO v = 2−0 by iSHELL
The primary target of the observation of CRL 2136 IRS 1 by iSHELL (Rayner et al. 2016) at the NASA Infrared Telescope Facility (IRTF) was the vibration-rotation transition of para-H2D+ (J, Ka, Kc) = (0, 0, 0) → (1, 1, 1) at 4.1618 μm. The iSHELL spectrograph has six cross-dispersion gratings that match each atmospheric window in the near infrared. The order sorting filter of the cross-dispersion grating Lp3 lets the incoming light through at 2.70–4.20 μm, which safely covers this absorption line of para-H2D+. A more complete description of the spectrograph is found on the IRTF website1.
The spectra were obtained on 2017 June 14 and 16 UT. The instrument was remotely operated from Munich, Germany. The full coverage of the optical setting Lp3 is 3.83–4.18 μm, which includes twoν3 transitions of ortho-H2D+, (1, 1, 1) → (2, 0, 2) [4.1361 μm] and (1, 1, 1) → (2, 2, 0) [3.9848 μm], and two H ν2 transitions from the ground para and ortho levels, Q(1, 1) [3.9286 μm] and Q(1, 0) [3.9530 μm]. The slit used was 0.′′375 in width to deliver R = 75 000, a velocity resolution of 4 km s−1. The slit was oriented at position angle of 45°. The telescope was nodded every other exposure along the slit (15′′ in length) to remove the sky emission. Flat field and arc lamp spectra were obtained after the science observations without changing the telescope pointing to avoid shaking the optics that might change the mapping of wavelengths on the detector. The para-H2D+ line falls on the diffraction order 124 that is only partially on the detector. For future observations of this line we suggest that the angle of the cross-dispersion grating be adjusted, instead of using the standard Lp3 setting, so that the entire order is on the detector, which makes the data extraction easier.
The raw data were reduced using xspextool adapted to iSHELL (Cushing et al. 2004). The extraction process includes detector linearity correction, flat fielding, coadding of spectral images, pair subtraction, rectification, aperture extraction, and wavelength mapping. As xspextool does not extract order 124, we used the IRAF aperture extraction package after xspextool performed all the preliminary steps. Wavelength calibration of the order of 124 was carried out by column-wise extrapolation of the higher order wavelength mapping (short wavelengths) to the order 124. Early-type standard stars HR 7001 (A0 V) and HR 7557 (A7 V) were observed using the same instrumental configuration, before or after the science observations. The removal of the telluric lines was carried out using the previously mentioned IDL program. The results are shown in Figs. 1 and 2.
The CO v = 2–0 lines at 2.3 μm ere observed on the same nights in June 2017. The grating setting used was K2 [2.09–2.38 μm], which covers the entire R-branch lines of CO v = 2–0 and P(1)–P(13). The slit width was 0.′′375 in order to attain R = 75 000. The position angle of the slit was 45°. The length of the slit was too short (5′′) to nod the telescope while keeping the source in the slit. Since the sky emission in this wavelength interval is negligible at this spectralresolution, the data were recorded with the source at the middle of the slit and without nodding to adjacent sky. Dark current images were obtained during the daytime, and subtracted from the science data. The one-dimensional spectra were extracted using xspextool. Early-type standard stars HR 7001 and HR 7557 were observed with the same instrument settings before or after the science observations. The removal of the telluric lines was carried out using the same IDL program discussed above. The results are shown in Fig. 3.
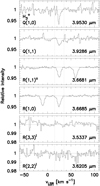 |
Fig. 1 Spectra at the wavelengths of several H |

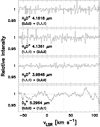 |
Fig. 2 Infrared spectra at the wavelengths of the vibrational transitions from the rotational ground levels of H |


2.3 D v = 1−0 by EXES
The ground-state vibration-rotation transition of D of the symmetry species
  , (ν1 ν2, J, G, U) = (00, 0, 0, 0) → (01, 1, 0, 1) occurs at 5.2964 μm (Ramanlal & Tennyson 2004). The transition is located near the edge of the M window, adjacent to strong telluric line of H2O, and is not accessible from the ground except in the driest conditions and for favorable Doppler shifts. The Echelon-cross-Echelle Spectrograph (EXES; Richter et al. 2010) is a high-resolution mid-infrared spectrograph used on the Stratospheric Observatory for Infrared Astronomy (SOFIA). SOFIA carries a 2.5 m diameter telescope, and flies 11–14 km above sea level, above 99% of the Earth’s water vapor. EXES is operative in the wavelength interval 4.5–28 μm at resolving powers up to R = 100 000. As no infrared satellites for astronomy have carried a spectrograph with resolving powers higher than 5000, EXES presents a unique opportunity to observe D
 .
.
The observation was carried out on 2017 May 26 by the EXES instrument on board SOFIA while the aircraft was flying over the southwest United States. The optical setting used was HIGH_MED with the telescope nodding along the slit. The slit width was 1.′′24 to deliver R = 100 000, or 3 km s−1. The angle of the echelle grating was set so that 5.296 μm was on the middle of the detector. The wavelength coverage of the spectrograph with this setting was 5.281–5.312 μm.
The data were reduced by Curtis DeWitt of the EXES instrument team. The fully calibrated one-dimensional spectrum was delivered to the SOFIA Data Cycle System. The archived spectrum shows sinusoidal patterns on the continuum. They were removed by subtracting a few Fourier components. The spectrum was divided by a model atmospheric transmission curve computed by ATRAN. The transmission of the atmosphere from SOFIA is smooth in this wavelength interval, without strong sky absorption lines. Wavelength calibration was performed with the reference to the telluric lines. The result is shown in Fig. 2.
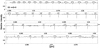 |
Fig. 3 Spectrum of CO v = 2–0 observed byiSHELL at IRTF. The lines covered are all positively detected. The transitions are identified with labels and dotted lines. |
3 Results and analysis
3.1 CO v = 2−0 lines
CO v = 2–0 lines of R(26) to P(13), in wavelength order, were detected by iSHELL. Their equivalent widths were measured by trapezoidal summation of the line profile. The uncertainties in the equivalent widths were calculated as the standard deviation of the nearby continuum multiplied by  , where Nλ is the sampling of the line profile, and Δλ is the span of the wavelength of one data point. The equivalent widths and the uncertainties were converted to level column densities using the spontaneous emission coefficients of Goorvitch (1994) available from the HITRAN database (Rothman et al. 2009)2. The results are shown in Table 1.
The level populations divided by the statistical weights gJ = 2J + 1 are plotted in Fig. 4 in blue as a function of the energy of the lower level. The curve is downward convex, as is seen in many similar observations (Goto et al. 2003, 2015). Such a population diagram can be caused by optically thick lines (Goldsmith & Langer 1999; Neufeld 2012) and does not necessarily require the presence of multiple temperature components.
In the present case, however, the velocity profiles of the lines argue for at least two temperature components. The profiles of the transitions from low J [R(1) and P(3)] and high J [R(21) and R(23)] are compared in Fig. 5. The low-J lines that presumably arise mainly in cold gas are centered at vLSR = + 23 km s−1, while the high-J lines are centered at + 27 km s−1. The radial velocity of the low-J lines are close to the systemic velocity of the central source, + 22.1 km s−1 (Maud et al. 2018). The low-J lines also show a wing at high positive velocities that matches the profiles of high-J lines.
The line center velocities and the full widths at half maximum (FWHMs) of the lines are plotted in Fig. 6. The high-J lines are broader (FWHM > 15 km s−1) and more redshifted, while the low-J lines are narrower (FWHM < 10 km s−1) and less redshifted. As the lines are all observed in absorption, they thus arise exclusively in the foreground. We interpret the line kinematics as follows: the cold cloud located in the foreground is at the cloud systemic velocity, while the warm gas near the central source is falling toward IRS 1, having detached from the cold cloud. As the shift of the central velocity cannot be accounted for by the optically thick lines, we conclude that there are at least two absorbing components on the line of sight that differ in temperature and kinematics.
The presence of two components does not necessarily mean that the absorption lines are not saturated. The low-velocity absorptions (vLSR = +23 km s−1) that dominate the low-J lines are deep (Fig. 5), and therefore are saturated to some degree. The line profiles are fitted by Gaussian functions, but with the centroid velocity fixed to +23 km s−1 and the Gaussian σ line width to 2.5 km s−1 (Fig. 5 in gray) in order to separate the low-velocity component from the broader absorption centered at + 27 km s−1. The line depth is the only free parameter at the fitting. The equivalent widths are calculated as the products of the peak depths and the line widths scaled by  . Figure 7 shows the population diagram of the low-velocity component isolated by the line profile fitting. We note that the level column densities of P-branch lines (open circles in blue) are systematically higher than those of R-branch lines (filled squares in blue).
This is a sign of a moderate saturation, where R-branch transitions are slightly more optically thick compared to P-branch transitions that start from the same rotational levels J (Lacy et al. 1994; Goto et al. 2015). We applied a curve of growth analysis to this low-velocity component to compensate the saturations. The optimal Doppler parameter b (=  1.6651) = 1.6 km s−1 is calculated so that the systematic difference between the level column densities of P- and R-branches is at a minimum (shown in red in Fig. 7).
After the curve of growth analysis is applied to the low-velocity component, the corrected equivalent widths are added back to the original absorption profile. In summary, the low-velocity absorption component (prominent in R(1) and P(3) in Fig. 5) is fitted by a Gaussian function, subtracted from the total line profile to calculate the residual absorption, and the saturation-corrected equivalent widths of the low-velocity component are added back to the residual absorption to restore the total equivalent widths. This treatment was necessary because there are at least two velocity components, and we wanted to apply the curve of growth analysis only to the low-velocity one since the warm and broad component is likely optically thin.
The partially corrected equivalent widths were converted to level column densities in the same way as before, and are shown in Table 1. The revised population diagram after the partial correction of the saturation (Fig. 4 in orange) was fitted assuming LTE distribution of populations with four parameters simultaneously [N(CO) and Tex for cold and warm components], and plotted over in Fig. 4.
The excitation temperature and the column density of the cold component are 58 ± 8 K and (1.6 ± 0.2) × 1019 cm−2. For the warm cloud the values are 530 ± 80 K and (2.8 ± 0.4) × 1019 cm−2. Thus, the column density of the warm cloud is about 1.7 times higher than that of the cold cloud. Its high temperatureindicates that it is situated within a hundred AU of CRL 2136 IRS 1. The total column density of 12CO is (4.4 ± 0.5) × 1019 cm−2. A summary is given in Table 2.
The rotational excitation temperature of the warm cloud agrees well with the value derived by Mitchell et al. (1990) ( K), who used 13CO fundamental lines at 4.8 μm; however, the temperature of the cold component they reported (
 K) is much lower than our value. The reason for the difference could be that the 13CO v = 1–0 lines are more optically thick than 12CO v = 2–0 lines. Mitchell et al. (1990) claimed thatthe 13CO lines are optically thin. However, the present spectra show that the low-J lines of the v = 2–0 band have optical depths near unity (Fig. 5). The absorption strengths of lines in this band are ~250 times weaker than those in the fundamental band of 12CO v = 1–0 starting from the same level (Zou & Varanasi 2002). For 12CO/13CO = 60–100 the low-J lines of the v = 1–0 band of 13CO have optical depths >2.5. At the excitation temperature of 58 K, the most optically thick lines are R(3) for 13CO v = 1–0 transitions, and R(1)–R(6) are more optically thick than R(0). The effect on the population diagram of underestimating the column densities of 13CO in these levels is to steepen the slope of the diagram at low J, resulting in a cooler derived excitation temperature.
Level column densities of CO.
3.2 Column densities of H
As shown in Fig. 1, the close pair of H lines, R(1,1)u and R(1,0), are detected, as they were by Geballe & Oka (1996). The detections of the Q(1,0) and Q(1,1) lines are new. The transitions from the excited states (2,2) and (3,3) are not detected. The equivalent widths were measured by trapezoidal summation of the line profiles, and have been converted to column densities using the Einstein A coefficients published by Neale et al. (1996)3. The results are summarized in Table 3.
The level column densities of (J,K) = (1,1) [para-H ], measured using the Q(1,1) and R(1,1)u lines, are consistent within the uncertainties. The weighted average of the two is N(1, 1) = (1.7 ± 0.1) × 1014 cm−2. The same applies to (J,K) = (1,0) [ortho-H
 ], measured byQ(1,0) and R(1,0); the weighted average of the two is N(1, 0) = (1.2 ± 0.1) × 1014 cm−2. This gives N(1, 0)∕N(1, 1) = 0.71 ± 0.10.
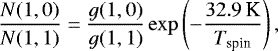
At low temperatures, where only the lowest rotational levels are populated, the ratio N(1,0)/N(1,1) is approximately equal to the ortho/para ratio of H , and we can write the spin temperature Tspin as
 (2)
(2)
where 32.9 K is the difference in energy between the two levels. The ratio of the statistical weights g(1,0)/g(1,1) is 2. In thermodynamic equilibrium, the spin temperature is equal to the kinetic temperature of the gas. The observed N(1,0)/N(1,1) ratio translates to Tspin = 32 ± 1 K, and is comparable to neither of the gas kinetic temperatures derived from CO spectrum.
The non-thermal distribution of the lowest rotational levels of H is commonly seen in the interstellar medium, most prominently in the diffuse molecular clouds in the Galactic center. In the Galactic center, the gas kinetic temperature has been estimated using the N(3,3)/N(1,1) population ratio. The (J,K) = (3,3) level is a metastable rotational state of ortho-H
 and (1,1) is the lowest rotational state of para-H
 . The N(3,3)/N(1,1) ratio is sensitive to the gas kinetic temperature and therefore serves as an excellent thermometer (Oka & Epp 2004; Le Petit et al. 2016). Oka et al. (2019) derive a gas kinetic temperature of 200 K in the CMZ in the Galactic center, while the spin temperature indicated by the N(1,0)/N(1,1) ratio is 30–50 K.
Oka & Epp (2004) used the principle of detailed balancing to calculate steady-state rotational level populations of H in the reactive collision system H
 + H2, while neglecting the nuclear spin conservation. They discuss that the non-thermal populations of the (1,1) and (1,0) states stem from the unique placement of the rotational energy levels of H
 in the vibrational ground state. The rotational levels with even J and K = 0 [e.g., (0,0) and (2,0)] are forbidden. The molecules in the lowest ortho state (1,0) are then more easily reactively excited to the low-lying para states (2,2) and (2,1) than to the second lowest ortho state (3,3). The excited (2,2) and (2,1) decay radiatively to the lowest para state (1,1). This results in a subthermal spin ratio for H
 . The spin temperature should therefore be taken as the lower limit of the gas kinetic temperature.
The critical density to collisionally populate CO rotational level J = 26 is n(H2) ≥ 108 cm−3 (Kramer et al. 2004). This is dense enough to thermalize the N(1,0)/N(1,1) ratio, and thus implies that the H ortho/para ratio there should be ~1.9, if the gas kinetic temperature is 530 K and Eq. (2) applies. This contradicts the observed ortho/para ratio 0.71. We therefore conclude that the vast majority of the H
 toward CRL 2136 IRS 1 is not located in the cloud containing the warm CO, and its absorption lines arise predominantly in the outer, less dense cloud.
This is not surprising; unlike CO, the column density of H is approximately independent of the total column density of clouds (Geballe & Oka 1996), but is proportional to the path length of the clouds. The path length of the warm n ~ 108 cm−3 gas, located close to CRL 2136 IRS 1, must be very short compared to that of the cold gas. The radial velocity of H
 matches with those of the intermediate-J lines [R(8) and P(8)] of CO v = 2–0 (Fig. 8) except for the lack of the red shoulder in CO, which is due to warm, dense gas near CRL 2136 IRS 1. These absorption lines starting from EJ∕k < 200 K are the main component of the cold gas of the temperature 58 K, as can be seen in the population diagram in Fig. 4.
Additional support for the lack of H in the warm, dense gas comes from the non-detections of the R(2,2)l and R(3,3)l lines. In the warm dense gas the populations of lower levels of these transitions would be in thermal equilibrium at the temperature of the warm gas, and those lines would be detected if the detected R(1,1)u and R(1,0) lines arose in that gas. The upper limit of N(3,3) indicates that the kinetic temperature is less than ~100 K.
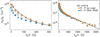 |
Fig. 4 Rotational population diagram of CO based on Table 1. Shown are the level column densities calculated assuming the absorption lines are not saturated (in blue; open circles and filledsquares, respectively) and after the low-velocity component is isolated by fitting Gaussian profiles and corrected by the curve of growth analysis (in orange). An expanded view of the low-J portion is shown in the left panel. The gray line is the best fit LTE population distribution of the two-temperature components of the observation. A summary of the model is given in Table 2. |
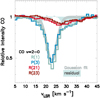 |
Fig. 5 Comparison of the absorption line profiles of CO v = 2–0 for the lines starting from low J [R(1) and P(3)] and high J [R(21) and R(23)]. The velocityrange of the gas toward CRL 2136 IRS 1 is marked by dotted vertical lines. Two velocity components centered at 23 km s−1 and 27 km s−1 are apparent. The low-velocity component at 23 km s−1 is fitted by aGaussian function, and is separated to apply the curve of growth analysis. The residual absorption is shown as the light blue shaded area. |
Summary of CO v = 2–0 diagnostics.
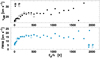 |
Fig. 6 Line center velocity and FWHM of CO v = 2–0 absorption lines as a function of the lower level energy. Two components are clearly seen with the warm (high-J) lines more redshifted from the observer, indicating that the warm component is falling toward the central source. |
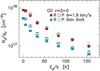 |
Fig. 7 Rotational population diagram of CO for low-velocity components (Fig. 5) before (in blue) and after (in red) the curve of growth analysis. The level column densities of P-branch lines (blueopen circles) calculated assuming an optically thin limit are systematically higher than those of R-branch lines (blue filled squares). The level column densities of P- and R-branch lines match reasonably well after correcting the optical depth by the curve of growth analysis. |
Column densities and upper limits for H and its isotopologues.
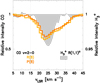 |
Fig. 8 Comparison of the absorption line profiles of CO v = 2–0 of the lines starting from the intermediate-J [R(8) and P(8)] and R(1,1)u
line of H |

3.3 Non-detections of H2D+
and D
None of the absorption lines of H2D+ or D were detected. The 3σ upper limits on the equivalent widths of the sought after lines are (2–5) × 10−6 μm. The upper limit to the level column density of D
 in the (J,G,U) = (0,0,0) state was computed using the spontaneous emission coefficient A = 25.3 s−1 taken from Amano et al. (1994). We note that A coefficients of D
 in Ramanlal & Tennyson (2004) are multiplied by the nuclear spin degeneracy gI, and should not be used as they are. For H2D+, the A coefficients published in Ramanlal & Tennyson (2004) and Sochi & Tennyson (2010), and made available at the ExoMol website, were used as they are.
As the R(3,3)l and R(2,2)l lines of H are not detected, we can safely assume that only the (1,0) and (1,1) levels of H
 are significantly populated. The total column density of H
 is therefore
  cm−2. For H2D+ and D
 , we take the population of the lowest levels as the total population, without taking into account the ortho/para ratios, because we have no knowledge of the rotationally excited states of the molecular ions. The 3σ upper limits are N(H2D+) < 6.0 × 1013 cm−2 and
  cm−2. The relative abundances to H
 are
are  and
and  . We would like to emphasize that these upper limits are for the populations on the lowest rotational levels with respect to H
 .
.
4 Discussion and conclusions
The non-detection of D toward CRL 2136 IRS 1 is consistent with the current understanding of how deuterium fractionation proceeds in the interstellar medium. Fractionation can be enhanced in a number of ways (Caselli et al. 2003, 2008; Walmsley et al. 2004; Flower et al. 2004). When CO is frozen onto the grain surfaces, and largely removed from the gas phase, the fractional abundance of H
 increases because the main destruction mechanism of H
 in dense clouds is the reaction with CO:
  . The increased abundance of H
 leads to the faster cooling of H2 nuclear-spin via reactive collisions with H
 . Ortho-H2 at J = 1 has 170 K additional energy than para-H2 at J = 0, and enables the backward version of reaction (1) even at very low cloud temperatures. The cooling of H2 nuclear-spin suppresses this H2D+ destruction path, and therefore works in favor of the deuterium fractionation. The fractionation is particularly efficient when CO abundance in the gas phase becomes lower than that of HD because HD then becomes the primary reaction partner of H
 through reaction (1).
This paper presents updated gas kinetic temperatures toward CRL 2136 IRS 1. Approximately one-third of the gas seen in CO is at 58 K and two-thirds is at 530 K. The cold component at 17 K deduced by Mitchell et al. (1990) from observations of the 13CO fundamental band can at most be only a minor contributor to the total column density. The CO sublimation temperature is ~25 K and little CO depletion is expected, even in the cooler component we found above. The column density of CO ice on CRL 2136 IRS 1 measured by Gibb et al. (2004) based on the ISO-SWS spectroscopy at 4.67 μm is 2.68 × 107 cm−2. This may be taken as an upper limit since the contribution of gas-phase CO absorption to this feature is not properly isolated. The CO depletion factor amounts to 2.68∕(163 + 2.68) = 1.6% at most, if the solid-phase CO is regarded as entirely in the cold component. At the temperature of 58 K, or even at 32 K, the lower limit implied by the H spin temperature, the Boltzmann factor of reaction (1) in the thermodynamical equilibrium, is not high enough to compensate the abundance of HD over H2, ~ 10−5. The non-detections of H2D+ and D
 toward CRL 2136 IRS 1, with upper limits 0.24 and 0.13 are therefore consistent with current understanding of fractionation.
SOFIA-EXES has opened easy access to D vibrational transition at 5.296 μm for the first time. The spectrograph and the telescope have given excellent performance in a wavelength interval that is often opaque for ground-based observers. However, reaching high enough signal-to-noise ratios to detect deuterated species with SOFIA requires observing toward some of the brightest infrared sources in the sky, which tends to exclude the most favorable cloud environments for deuterium fractionation. We are looking forward to further performance gains in the instrumentation of high-resolution thermal infrared spectroscopy.
Acknowledgements
M.G. thanks the staff and crew of the IRTF, in particular, Mike Connelley, Brian Cabreira, and Adwin Boogert. Mike Cushing and Adwin Boogert helped tremendously in the data reduction using xspextool adapted to iSHELL. M.G. also thanks Elena Valenti and Francesca Primas who helped to conduct the observation in a timely manner by CRIRES at the VLT in Director’s Discretionary Time. The authors appreciate the hospitality of the Hawaiian and Chilean communities that made the research presented here possible. M.G. thanks to Curtis DeWitt, Mat Richter and Adwin Boogert of the EXES instrumentation team who conducted actual observations from the aircraft, and delivered the reduced data to the SOFIA Data Cycle System. M.G. thanks to the anonymous reviewer for the constructive feedback. This research has made use of NASA’s Astrophysics Data System. This research has made use of the SIMBAD database, operated at CDS, Strasbourg, France. M.G. is supported by the German Research Foundation (DFG) grant GO 1927/6-1. T.R.G.’s research is supported by the Gemini Observatory, which is operated by the Association of Universities for Research in Astronomy, Inc., under a cooperative agreement with the NSF on behalf of the Gemini partnership: the National Science Foundation (United States), National Research Council (Canada), CONICYT (Chile), Ministerio de Ciencia, Tecnología e Innovación Productiva (Argentina), Ministério da Ciência, Tecnologia e Inovação (Brazil), and Korea Astronomy and Space Science Institute (Republic of Korea).
References
- Amano, T., & Watson, J. 1984, Phys. Rev. A, 81, 2689 [Google Scholar]
- Amano, T., Chan, M.-C., Civis, S., et al. 1994, Can. J. Phys., 72, 1007 [NASA ADS] [CrossRef] [Google Scholar]
- Brünken, S., Sipilä, O., Chambers, E. T., et al. 2014, Nature, 516, 219 [NASA ADS] [CrossRef] [PubMed] [Google Scholar]
- Caselli, P., van der Tak, F. F. S., Ceccarelli, C., & Bacmann, A. 2003, A&A, 403, L37 [NASA ADS] [CrossRef] [EDP Sciences] [Google Scholar]
- Caselli, P., Vastel, C., Ceccarelli, C., et al. 2008, A&A, 492, 703 [NASA ADS] [CrossRef] [EDP Sciences] [Google Scholar]
- Cushing, M. C., Vacca, W. D., & Rayner, J. T. 2004, PASP, 116, 362 [NASA ADS] [CrossRef] [Google Scholar]
- Flower, D. R., Pineau des Forêts, G., & Walmsley, C. M. 2004, A&A, 427, 887 [NASA ADS] [CrossRef] [EDP Sciences] [Google Scholar]
- Geballe, T. R., & Oka, T. 1996, Nature, 384, 334 [NASA ADS] [CrossRef] [PubMed] [Google Scholar]
- Geballe, T. R., & Oka, T. 2010, ApJ, 709, L70 [NASA ADS] [CrossRef] [Google Scholar]
- Geballe, T. R., Lambrides, E., Schlegelmilch, B., et al. 2019, ApJ, 872, 103 [NASA ADS] [CrossRef] [Google Scholar]
- Gibb, E. L., Whittet, D. C. B., Boogert, A. C. A., & Tielens, A. G. G. M. 2004, ApJS, 151, 35 [NASA ADS] [CrossRef] [PubMed] [Google Scholar]
- Goldsmith, P. F., & Langer, W. D. 1999, ApJ, 517, 209 [NASA ADS] [CrossRef] [Google Scholar]
- Goorvitch, D. 1994, ApJS, 95, 535 [NASA ADS] [CrossRef] [Google Scholar]
- Goto, M., McCall, B. J., Geballe, T. R., et al. 2002, PASJ, 54, 951 [NASA ADS] [CrossRef] [Google Scholar]
- Goto, M., Usuda, T., Takato, N., et al. 2003, ApJ, 598, 1038 [NASA ADS] [CrossRef] [Google Scholar]
- Goto, M., Usuda, T., Geballe, T. R., et al. 2011, PASJ, 63, L13 [NASA ADS] [CrossRef] [Google Scholar]
- Goto, M., Usuda, T., Geballe, T. R., et al. 2013, A&A, 558, L5 [NASA ADS] [CrossRef] [EDP Sciences] [Google Scholar]
- Goto, M., Geballe, T. R., Indriolo, N., et al. 2014, ApJ, 786, 96 [NASA ADS] [CrossRef] [Google Scholar]
- Goto, M., Geballe, T. R., & Usuda, T. 2015, ApJ, 806, 57 [NASA ADS] [CrossRef] [Google Scholar]
- Harju, J., Sipilä, O., Brünken, S., et al. 2017, ApJ, 840, 0 [Google Scholar]
- Indriolo, N., Neufeld, D. A., Seifahrt, A., & Richter, M. J. 2013, ApJ, 776, 8 [NASA ADS] [CrossRef] [Google Scholar]
- Jefferts, K. B., Penzias, A. A., & Wilson, R. W. 1973, ApJ, 179, L57 [NASA ADS] [CrossRef] [Google Scholar]
- Kaeufl, H.-U., Ballester, P., Biereichel, P., et al. 2004, Proc. SPIE, 5492, 1218 [CrossRef] [Google Scholar]
- Kramer, C., Jakob, H., Mookerjea, B., et al. 2004, A&A, 424, 887 [NASA ADS] [CrossRef] [EDP Sciences] [Google Scholar]
- Lacy, J. H., Knacke, R., Geballe, T. R., & Tokunaga, A. T. 1994, ApJ, 428, L69 [NASA ADS] [CrossRef] [Google Scholar]
- Le Petit, F., Ruaud, M., Bron, E., et al. 2016, A&A, 585, A105 [NASA ADS] [CrossRef] [EDP Sciences] [Google Scholar]
- Linsky, J. L., Draine, B. T., Moos, H. W., et al. 2006, ApJ, 647, 1106 [NASA ADS] [CrossRef] [Google Scholar]
- Lord, S. D. 1992, NASA Tech. Memo., 103957, 1 [Google Scholar]
- Maud, L. T., Cesaroni, R., Kumar, M. S. N., et al. 2018, A&A, 620, A31 [NASA ADS] [CrossRef] [EDP Sciences] [Google Scholar]
- Mitchell, G. F., Maillard, J.-P., Allen, M., Beer, R., & Belcourt, K. 1990, ApJ, 363, 554 [NASA ADS] [CrossRef] [Google Scholar]
- Murakawa, K., Preibisch, T., Kraus, S., & Weigelt, G. 2008, A&A, 490, 673 [NASA ADS] [CrossRef] [EDP Sciences] [Google Scholar]
- Neale, L., Miller, S., & Tennyson, J. 1996, ApJ, 464, 516 [NASA ADS] [CrossRef] [Google Scholar]
- Neufeld, D. A. 2012, ApJ, 749, 125 [NASA ADS] [CrossRef] [Google Scholar]
- Oka, T. 2013, Chem. Rev., 113, 8738 [CrossRef] [PubMed] [Google Scholar]
- Oka, T., & Epp, E. 2004, ApJ, 613, 349 [NASA ADS] [CrossRef] [Google Scholar]
- Oka, T., Geballe, T. R., Goto, M., et al. 2019, ApJ, 883, 54 [NASA ADS] [CrossRef] [Google Scholar]
- Parise, B., Belloche, A., Du, F., Güsten, R., & Menten, K. M. 2011, A&A, 526, A31 [NASA ADS] [CrossRef] [EDP Sciences] [Google Scholar]
- Ramanlal, J., & Tennyson, J. 2004, MNRAS, 354, 161 [NASA ADS] [CrossRef] [Google Scholar]
- Rayner, J., Tokunaga, A., Jaffe, D., et al. 2016, Proc. SPIE, 9908, 990884 [CrossRef] [Google Scholar]
- Richter, M. J., Ennico, K. A., McKelvey, M. E., & Seifahrt, A. 2010, Proc. SPIE, 7735, 77356Q [NASA ADS] [CrossRef] [Google Scholar]
- Roberts, H., Herbst, E., & Millar, T. J. 2003, ApJ, 591, L41 [NASA ADS] [CrossRef] [Google Scholar]
- Rothman, L., Gordon, I., Barbe, A., & Benner, D. 2009, J. Quant. Spectr. Rad. Transf., 110, 533 [NASA ADS] [CrossRef] [Google Scholar]
- Roueff, E., Parise, B., & Herbst, E. 2007, A&A, 464, 245 [NASA ADS] [CrossRef] [EDP Sciences] [Google Scholar]
- Sipilä, O., Hugo, E., Harju, J., et al. 2010, A&A, 509, A98 [NASA ADS] [CrossRef] [EDP Sciences] [Google Scholar]
- Sochi, T., & Tennyson, J. 2010, MNRAS, 405, 2345 [NASA ADS] [Google Scholar]
- Steigman, G. 2007, Ann. Rev. Nucl. Part. Syst., 57, 463 [Google Scholar]
- Tennyson, J., Yurchenko, S. N., Al-Refaie, A. F., et al. 2016, J. Mol. Spectr., 327, 73 [NASA ADS] [CrossRef] [Google Scholar]
- Vastel, C., Phillips, T. G., & Yoshida, H. 2004, ApJ, 606, L127 [NASA ADS] [CrossRef] [Google Scholar]
- Walmsley, C. M., Flower, D. R., & Pineau des Forêts, G. 2004, A&A, 418, 1035 [NASA ADS] [CrossRef] [EDP Sciences] [Google Scholar]
- Watson, W. D. 1973, ApJ, 181, L129 [NASA ADS] [CrossRef] [Google Scholar]
- Zou, Q., & Varanasi, P. 2002, J. Quant. Spectr. Rad. Transf., 75, 63 [NASA ADS] [CrossRef] [Google Scholar]
Retrieved from the ExoMol (Tennyson et al. 2016) web site at http://exomol.com
All Tables
All Figures
|
Fig. 1 Spectra at the wavelengths of several H |
| In the text | |
|
Fig. 2 Infrared spectra at the wavelengths of the vibrational transitions from the rotational ground levels of H |
| In the text | |
|
Fig. 3 Spectrum of CO v = 2–0 observed byiSHELL at IRTF. The lines covered are all positively detected. The transitions are identified with labels and dotted lines. |
| In the text | |
|
Fig. 4 Rotational population diagram of CO based on Table 1. Shown are the level column densities calculated assuming the absorption lines are not saturated (in blue; open circles and filledsquares, respectively) and after the low-velocity component is isolated by fitting Gaussian profiles and corrected by the curve of growth analysis (in orange). An expanded view of the low-J portion is shown in the left panel. The gray line is the best fit LTE population distribution of the two-temperature components of the observation. A summary of the model is given in Table 2. |
| In the text | |
|
Fig. 5 Comparison of the absorption line profiles of CO v = 2–0 for the lines starting from low J [R(1) and P(3)] and high J [R(21) and R(23)]. The velocityrange of the gas toward CRL 2136 IRS 1 is marked by dotted vertical lines. Two velocity components centered at 23 km s−1 and 27 km s−1 are apparent. The low-velocity component at 23 km s−1 is fitted by aGaussian function, and is separated to apply the curve of growth analysis. The residual absorption is shown as the light blue shaded area. |
| In the text | |
|
Fig. 6 Line center velocity and FWHM of CO v = 2–0 absorption lines as a function of the lower level energy. Two components are clearly seen with the warm (high-J) lines more redshifted from the observer, indicating that the warm component is falling toward the central source. |
| In the text | |
|
Fig. 7 Rotational population diagram of CO for low-velocity components (Fig. 5) before (in blue) and after (in red) the curve of growth analysis. The level column densities of P-branch lines (blueopen circles) calculated assuming an optically thin limit are systematically higher than those of R-branch lines (blue filled squares). The level column densities of P- and R-branch lines match reasonably well after correcting the optical depth by the curve of growth analysis. |
| In the text | |
|
Fig. 8 Comparison of the absorption line profiles of CO v = 2–0 of the lines starting from the intermediate-J [R(8) and P(8)] and R(1,1)u
line of H |
| In the text | |
Current usage metrics show cumulative count of Article Views (full-text article views including HTML views, PDF and ePub downloads, according to the available data) and Abstracts Views on Vision4Press platform.
Data correspond to usage on the plateform after 2015. The current usage metrics is available 48-96 hours after online publication and is updated daily on week days.
Initial download of the metrics may take a while.