Fig. 5
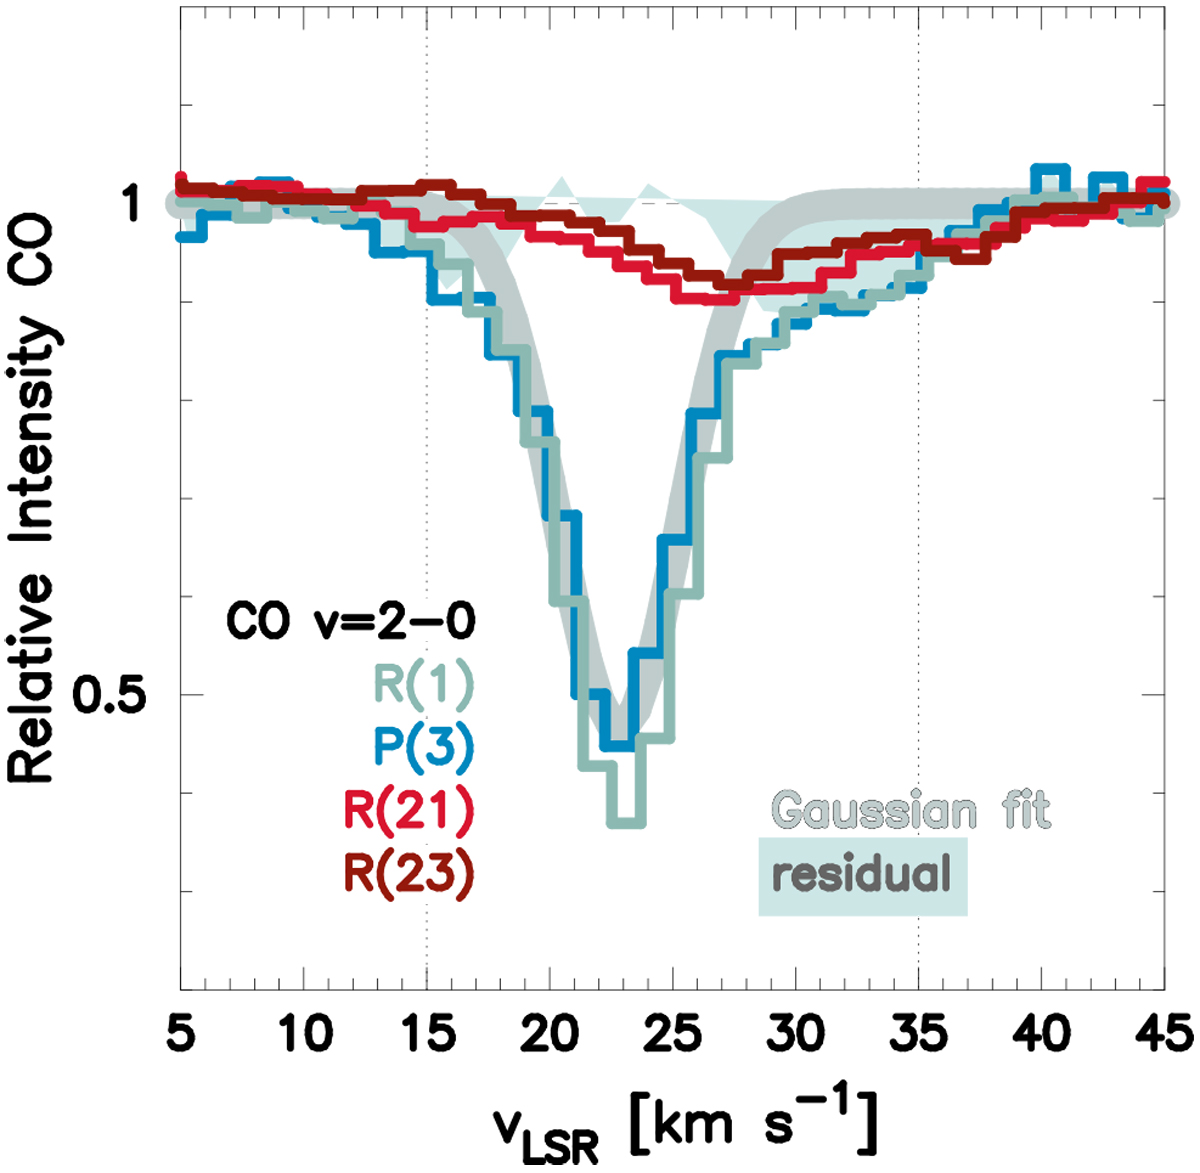
Comparison of the absorption line profiles of CO v = 2–0 for the lines starting from low J [R(1) and P(3)] and high J [R(21) and R(23)]. The velocityrange of the gas toward CRL 2136 IRS 1 is marked by dotted vertical lines. Two velocity components centered at 23 km s−1 and 27 km s−1 are apparent. The low-velocity component at 23 km s−1 is fitted by aGaussian function, and is separated to apply the curve of growth analysis. The residual absorption is shown as the light blue shaded area.
Current usage metrics show cumulative count of Article Views (full-text article views including HTML views, PDF and ePub downloads, according to the available data) and Abstracts Views on Vision4Press platform.
Data correspond to usage on the plateform after 2015. The current usage metrics is available 48-96 hours after online publication and is updated daily on week days.
Initial download of the metrics may take a while.