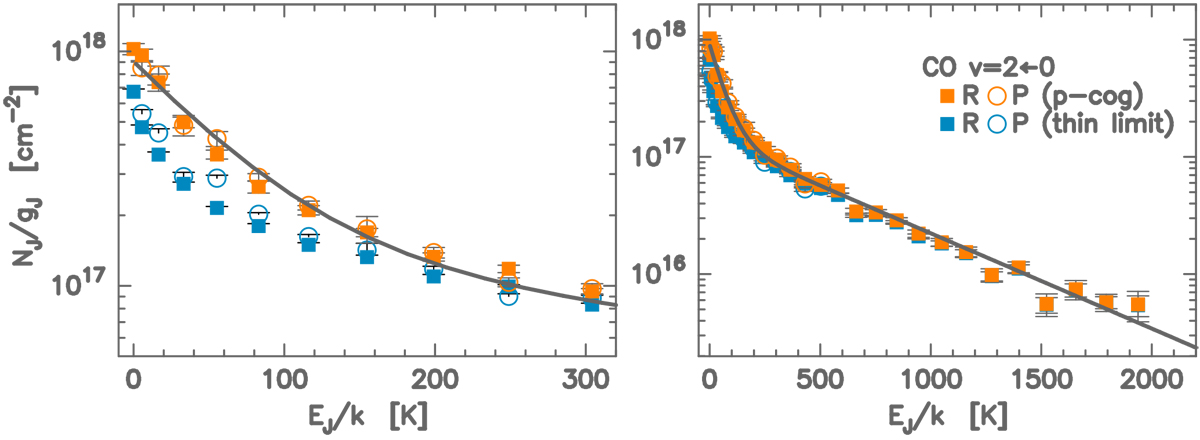
Fig. 4

Rotational population diagram of CO based on Table 1. Shown are the level column densities calculated assuming the absorption lines are not saturated (in blue; open circles and filledsquares, respectively) and after the low-velocity component is isolated by fitting Gaussian profiles and corrected by the curve of growth analysis (in orange). An expanded view of the low-J portion is shown in the left panel. The gray line is the best fit LTE population distribution of the two-temperature components of the observation. A summary of the model is given in Table 2.
Current usage metrics show cumulative count of Article Views (full-text article views including HTML views, PDF and ePub downloads, according to the available data) and Abstracts Views on Vision4Press platform.
Data correspond to usage on the plateform after 2015. The current usage metrics is available 48-96 hours after online publication and is updated daily on week days.
Initial download of the metrics may take a while.


