| Issue |
A&A
Volume 599, March 2017
|
|
|---|---|---|
| Article Number | A54 | |
| Number of page(s) | 12 | |
| Section | Stellar structure and evolution | |
| DOI | https://doi.org/10.1051/0004-6361/201629622 | |
| Published online | 28 February 2017 | |
Subdwarf B stars from the common envelope ejection channel
1 Yunnan Observatories, Chinese Academy of Sciences, 396 Yangfangwang, Guandu District, 650216 Kunming, PR China
e-mail: cxf@ynao.ac.cn; zhanwenhan@ynao.ac.cn
2 Key Laboratory for the Structure and Evolution of Celestial Objects, Chinese Academy of Sciences, 396 Yangfangwang, Guandu District, 650216 Kunming, PR China
3 Center for Astronomical Mega-Science, Chinese Academy of Sciences, 20A Datun Road, Chaoyang District, 100012 Beijing, PR China
4 University of Chinese Academy of Sciences, 100049 Beijing, PR China
5 Department of Astrophysics, University of Oxford, Oxford OX1 3RH, UK
Received: 29 August 2016
Accepted: 5 January 2017
Context. Subdwarf B stars (sdB) are important to stellar evolutionary theory and asteroseismology, and they are crucial to our understanding of the structure and evolution of the Galaxy. According to the canonical binary scenario, the majority of sdBs are produced from low-mass stars with degenerate cores where helium is ignited in a way of flashes. Owing to numerical difficulties, the models of produced sdBs are generally constructed from more massive stars with non-degenerate cores. This leaves several uncertainties on the exact characteristics of sdB stars.
Aims. The purpose of this paper is to study the characteristics of sdBs produced from the common envelope (CE) ejection channel.
Methods. We used the stellar evolution code Modules for Experiments in Stellar Astrophysics (MESA), which can resolve flashes during stellar evolution. To mimic the CE ejection process, we first evolved a single star to a position near the tip of the red giant branch, then artificially removed its envelope with a very high mass-loss rate until the envelope began to shrink. Finally, we followed the evolution of the remnant until it became a helium or a carbon-oxygen white dwarf.
Results. The sdB stars produced from the CE ejection channel appear to form two distinct groups on the effective temperature-gravity diagram. One group, referred to as the flash-mixing sdBs, almost has no H-rich envelope and crowds at the hottest temperature end of the extreme horizontal branch (EHB), while the other group, called the canonical sdBs, has significant H-rich envelope and is spread throughout the entire canonical EHB region. The key factor for the dichotomy of the sdB properties is the development of convection during the first helium flash, that is, that the convection region penetrates the H-rich envelope in the case of the flash-mixing sdBs, but fails to do this in the case of the canonical sdBs.
Conclusions. The dichotomy of the sdB properties from the CE ejection channel is intrinsic and caused by the interior structure of the star after the CE ejection. The modelling of the CE ejection process will greatly change the parameter space for the two typical groups of sdB stars. If the CE ejection stops early for a given initial stellar mass and a given core mass at the onset of the CE, then the star has a relatively massive H-rich envelope, which generally results in a canonical sdB. Observationally, only a few sdB binaries with short orbital periods are located in the flash-mixing sdB region, and there is a lack of He-rich sdBs in binaries with short orbital periods. This indicates that flash mixing is not very frequent in products of the CE ejection. A falling-back process after the CE ejection, similar to what occurs in nova, is an appropriate way of increasing the envelope mass, and it then prevents flash mixing.
Key words: binaries: close / stars: evolution / subdwarfs
© ESO, 2017
1. Introduction
In the Hertzsprung-Russell diagram (HRD), subdwarf B (sdB) stars are located between the upper main sequence (MS) and the white dwarf (WD) cooling sequence at the blueward extension of the horizontal branch. They are also known as extreme horizontal-branch (EHB) stars in globular clusters (GCs). SdB stars are important in several aspects. The study of their origin significantly improved our knowledge of stellar and binary evolution theory (see the review of Heber 2009, 2016). Short-period sdB binary systems are candidates of type Ia supernova progenitors (Maxted et al. 2000a; Wang & Han 2009). Many sdB stars show multiperiodic pulsations, and those stars are important objects of asteroseismology study (Charpinet et al. 2010). SdB stars have been used as distance indicators and as a probe to study the Galactic structure and evolution (see the review of Heber 2009, 2016; Altmann et al. 2004). They are also considered to be crucial sources of far-ultraviolet radiation in early-type galaxies (Ferguson et al. 1991; Brown et al. 2000; Han et al. 2007) since they are hot (with an effective temperature Teff of between 20 000–40 000 K) and have relatively long lifetimes (~108 yr).
SdB stars are generally believed to be helium-core-burning stars with extremely thin hydrogen envelopes (<0.02 M⊙). More than half of them are found in binaries (Maxted et al. 2001; Napiwotzki et al. 2004; Copperwheat et al. 2011). Han et al. (2002, 2003) developed a detailed binary model for the formation of sdBs that successfully explains field sdBs, possibly EHB stars in GCs (Han 2008), and sdBs on long-orbital periods observed recently (Chen et al. 2013). In the binary scenario, there are three formation channels for sdBs: stable Roche-lobe overflow (RLOF) for those with long orbital periods, common envelope (CE) ejection for those with short orbital periods, and the merger of helium white dwarfs (WD) for single sdBs.
The key point of the three channels is the He ignition in the core. In most instances, the He core is degenerate and the He ignition is explosive, that is, there are several He flashes before stable He core burning is established. Because of numerical difficulties in dealing with flashes in most stellar evolution codes, almost all the sdB models are artificially constructed from relatively massive stars with non-degenerate cores (e.g. Brown et al. 2001; Han et al. 2002). The constructed sdB stars generally have the same core mass as in the progenitors at the He ignition, but the composition in the envelope may be different based on different assumptions. The He flashes may alter envelope mass and element abundances (Brown et al. 2001; Sweigart et al. 2004). A detailed study of the He flash process before the stable He-core burning is necessary and important for our understanding of the characteristics of sdB stars and for the study of asteroseismology. The newly developed stellar evolution code MESA (Modules for Experiments in Stellar Astrophysics, Paxton et al. 2011, 2013, 2015) can resolve dramatic changes such as flashes in stellar evolution and therefore provides a good opportunity for studying the characteristics of sdBs in details. In general, the basic equations of stellar structure and evolution are written as difference equations in stellar evolution codes. The dramatic changes in stellar structure such as flashes make the difference approximation invalid and the codes are then difficult to converge. MESA employs adaptive mesh refinement and sophisticated timestep controls, and the convergence criteria will be automatically adjusted under some difficult circumstances such as flashes. All these factors facilitate using MESA to deal with the dramatic changes in stellar structures without the convergence problem (Paxton et al. 2011, 2013).
Schindler et al. (2015) constructed a series of sdB models using MESA. These models reproduced the general properties of the zero-age EHB and the interior structures of sdB stars from asteroseismology. The origin of sdB stars is ignored in their study, which may play a crucial role in the structure of sdB stars, especially for the mass and composition in the envelope. For example, sdB stars from stable RLOF are considered to have a higher envelope mass than those from the CE ejection channel (Han et al. 2002). This envelope mass may further affect the He flash process and the final envelope mass and composition of sdB stars. Much evidence shows that most of sdBs are in short orbit-period binaries (Saffer et al. 1998; Jeffery & Pollacco 1998; Koen et al. 1998; Orosz & Wade 1999; Moran et al. 1999; Maxted et al. 2000a,b, 2001; Barlow et al. 2013; Kupfer et al. 2015). This means that the CE ejection channel is a major mechanism for producing sdBs.
In this paper, we employ MESA to systematically study the characteristics of sdBs from the CE ejection channel. In Sect. 2 we introduce the basic inputs in the code and the method of simulating the CE process. The results are presented in Sect. 3, where we describe that the sdB stars produced from the CE ejection channel show two distinct groups on the effective temperature-gravity diagram. In Sect. 4 we discuss how the results are influenced by the treatment of CE ejection, mass loss during He flashes, metallicity, and some observationally related objects. A conclusion is given in Sect. 5.
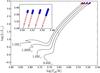 |
Fig. 1 Evolutionary tracks on the Hertzsprung-Russell diagram for the four stars studied in the paper. The X and the filled dot mark the positions where the star fills its Roche lobe and begins the CE evolution. The X shows stars with a strong H flash after the main He flash and the filled dots stars without such a strong H flash (see text for details). |
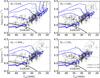 |
Fig. 2 Evolutionary tracks of the produced sdB stars on the effective temperature-gravity (Teff−log g) diagram. Initial stellar mass, Mi, and the position of zero-age helium main sequence (ZAHeMS, the thick-solid line) are indicated. The shaded area between the lowest two lines in each panel shows the region of the evolutionary tracks of the flash-mixing models (see the text for details) for clarity. The age difference between adjacent crosses is 107 yr. The dots and diamonds are sdBs with short orbital periods from Maxted et al. (2001), Kupfer et al. (2015), respectively. The grey lines are the tracks during helium flashes before stable He-core burning. |
2. Stellar evolution calculations
We used version 7184 of MESA and adopted the physics options similar to those in the standard model of Schindler et al. (2015), that is, the element abundances are chosen for population I stars, Z = 0.02 and X = 0.70 for the metallicity and hydrogen mass fraction, respectively, and the nuclear network is ![\hbox{$pp\underline{\makebox[1em]{}}cno\underline{\makebox[1em]{}} extras\underline{\makebox[1em]{}}o18\underline{\makebox[1em]{}}ne22.net$}](/articles/aa/full_html/2017/03/aa29622-16/aa29622-16-eq11.png) , in which all relevant reactions for H and He burning are included. The mixing length parameter, αMLT, is set to 2 and the opacity table is OPAL type II, which allows the abundances of C and O to vary with time. For simplicity, no stellar wind or other mass loss is included in our calculations except for the CE ejection.
, in which all relevant reactions for H and He burning are included. The mixing length parameter, αMLT, is set to 2 and the opacity table is OPAL type II, which allows the abundances of C and O to vary with time. For simplicity, no stellar wind or other mass loss is included in our calculations except for the CE ejection.
In the CE ejection channel, the progenitor of an sdB is a giant and fills its Roche lobe near the tip of red giant branch (RGB). The following mass transfer is dynamically unstable, and a common envelope forms. The donor core and the companion spiral in the CE. As a result of the friction between the inner binary and the CE, the orbit decays and the orbital energy is released and deposited in the envelope. The envelope may be ejected eventually when the released orbital energy is higher than the binding energy of the envelope (Han et al. 2002). The whole process is dynamical (with a timescale of ~103 yr, see Ivanova et al. 2013,and references therein), and cannot yet be simulated by MESA. We therefore modelled this process in a way similar to that of Han et al. (2002). We first evolved a single star to the position where the CE begins (near the tip of RGB), then artificially removed the envelope with a high mass-loss rate (10-3M⊙ yr-1). In general, the giant expands dramatically as a result of mass loss and suddenly contracts after almost all of the envelope has been lost. We stopped the mass loss when the star started to collapse, that is, when the radius of the star, R, was equal to the initial radius at the beginning of mass loss, R0. The evolution of the remnant was followed until the surface temperature is lower than 5000 K, that is, the star evolved to a cool He WD or a carbon-oxygen WD (after an sdB phase). The treatment of the CE process may affect the properties of the produced sdBs, as discussed in Sect. 4.
We adopted four initial stellar masses (the mass donor) for our study: Mi = 0.8 M⊙, 1.0 M⊙, 1.26 M⊙, and 1.5 M⊙. For each mass, we systematically investigated a series of positions where the CE begins on the RGB, that is, the core mass increases from the minimum mass allowed for He ignition to the tip of RGB in steps of 0.002 M⊙. If the core mass at the onset of the CE is lower than the minimum mass, helium cannot be ignited and the remnant will directly evolve into a He WD (see Han et al. 2002). Figure 1 shows the positions to be studied on the evolutionary tracks. The initial mass and core mass for each point are listed in Table 1.
3. Characteristics of sdB stars from our models
3.1. Location on the Teff–log g diagram
We calculated 44 models and all the produced sdBs are presented on the temperature-gravity (Teff−log g) diagram (Fig. 2), which shows that for each donor the produced sdB stars are clearly separated into two groups. One group has almost no H-rich envelope and is crowded at the hottest temperature end of the EHB, very close to zero-age helium main sequence (ZAHeMS, the thick-solid lines). The other group has a significant H-rich envelope and is spread throughout the entire canonical EHB region. The effective temperature increases discontinuously at the transition between the two groups, leaving a gap on Teff−log g diagram. Only two products are found to be located in the gap from our models. The products in the first group have higher He and C abundances in the envelope than those in the second group (Table 1). In the following, we show that the convection developed during the first He flash causes the dichotomy of the sdB properties. For convenience, we refer to the first class as the flash-mixing sdBs and to the second class as the canonical sdBs.
The observed sdB binaries with short-orbital periods (Maxted et al. 2001; Kupfer et al. 2015) are presented in Fig. 2 for comparison. Most sdBs can be reproduced by the canonical sdBs, but several sdBs are located in the blue extension of the canonical sdBs, that is, some are located in the gap between the two groups and some are on the flash-mixing sdB tracks, but the number density is obviously lower than that in the canonical sdB region. We discuss this in Sect. 4.1. A few sdBs are obviously bluer or hotter (with Teff> 34 000 K and log g< 5.6) than the others and are located in a region through which our models pass quite quickly. These samples are very probably not produced by our models because all the donors here have degenerated cores and the produced sdBs have very similar masses of about 0.47 M⊙. By comparing the location of these objects with the locations in panel (d) of Fig. 2 of Han et al. (2002), we found that these sdBs probably have masses more massive than 0.55 M⊙. Then, to produce such sdBs, the initial mass of the progenitors should be more massive than 3.2 M⊙ according to Table 1 of Han et al. (2002).
3.2. Origin of the dichotomy in the sdB properties
For each group of sdBs, we chose one typical model to show the details during He flashes. The model for the flash-mixing sdBs has an initial mass of 0.8 M⊙ and a core mass of 0.448 M⊙ at the onset of the CE ejection. The model for the canonical sdBs has the same initial mass, but a core mass of 0.458 M⊙ at the onset of CE ejection. Figure 3 shows their evolutionary tracks after the CE ejection on the HRD and the positions of the first He and H flashes.
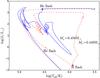 |
Fig. 3 Typical evolutionary tracks (starting from the end of the CE ejection) for the two groups of sdBs produced from the CE ejection channel. The two models have the same initial masses (Mi = 0.8 M⊙), but different core masses at the onset of the CE ejection, that is, Mc = 0.448 M⊙ for that of the flash-mixing sdB (the dashed line) and 0.458 M⊙ for that of the canonical sdB (the solid line), respectively. The plus and the filled dot show the positions where the first He and H flash occur, respectively. |
The flash-mixing model is shown as the red dashed line in Fig. 3. For this model, the first He flash occurs when the star descends the WD cooling sequence, and it is followed by a very strong H flash. The He- and H-burning luminosities during the flashes are presented in Fig. 4, where the structure of convection near the surface is also presented to understand the surface composition of the products, then their positions on HRD. Figure 4 shows that the convection has developed during the He flash and penetrates the H-rich envelope (the H-rich boundary is defined as that with H abundance X = 0.1). Most of the H-rich matter has been included into the hot helium-burning region and is ignited. We therefore see an additional strong H flash following the He flash. The maximum luminosity of the H flash is LH ~ 1010L⊙, even higher than that of the He flash. As a result, almost all H has been burnt into He and the remnant is almost a naked He core. All the flash-mixing sdBs have similar processes during the first He flash and crowd at the hottest temperature end of the EHB, very close to ZAHeMS.
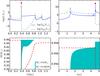 |
Fig. 4 Temporal evolution of the H- and He-burning luminosity (upper panels) and the structure of convection region (the shaped region) near the surface (bottom panels) during the flashes. The model has Mi = 0.8 M⊙ and Mc = 0.448 M⊙ at the onset of the CE ejection. The plus and the filled dot show the positions where the first He and H flash occur, respectively (see Fig. 3). The dashed line in the bottom panels is the boundary of the H-rich envelope, that is, the H mass abundance of XH = 0.1. The convection developed during the first He flash penetrates the H-rich envelope, resulting in an additional very strong H flash. The right two panels zoom in on the first He and H flashes. |
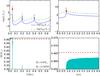 |
Fig. 5 Similar to Fig. 4, but for Mi = 0.8 M⊙, Mc = 0.458 M⊙. The convection developed during the He flashes never penetrates the H-rich envelope, and the strong H flash of Fig. 4 fails to appear here. |
For the canonical model (the blue solid line in Fig. 3), however, the first He flash occurs much earlier, when the star approaches the maximum temperature after the CE ejection, and the convection region developed in the flash never penetrates the H-rich envelope (see Fig. 5). The H-rich matter is therefore not included in the hot helium burning region, and the strong H flash that appeared in the flash-mixing model never occurs in this model. The H-burning is moderate in the envelope, and significant H-rich material has been left when the stable He-core burning is established. The sdBs produced in this way spread throughout the entire sdB region, and the exact location on the Teff−log g diagram is related to the H-rich envelope mass that is left, as studied previously (Lanz et al. 2004; Heber 2016).
Whether the temporary convection induced by the first He flash penetrates the H-rich envelope depends on the position at which the first He flash occurs, as discussed by Brown et al. (2001). If the first He flash occurs just after the end of mass loss (due to a strong wind, the CE ejection or Roche lobe overflow), that is, when the star approaches the maximum temperature or near the top of the WD cooling sequence, then a high entropy barrier at the bottom of the H-rich envelope prevents the convection from penetrating the envelope. The entropy barrier is caused by H-shell burning in the red giants and is maintained when the remnant moves toward the maximum effective temperature just after the end of CE ejection as a result of relatively high H-shell burning rates during this phase, but it becomes lower and lower when the remnant descends the WD cooling curve because of the decrease of the energy production rate in the H-burning shell resulting from the decrease in temperature within the shell. The convection then penetrates the entropy barrier and very easily enters the H-rich envelope. As a consequence, most of H in the envelope is burnt (see also Iben 1984; Castellani & Castellani 1993; D’Cruz et al. 1996; Lanz et al. 2004). This leads to the dichotomy in sdB properties and to a discontinuous increase in Teff between the two classes, leaving a gap on the Teff−log g diagram, as presented in Fig. 2.
The mixing between the core and the H-rich envelope may be complete or incomplete. This furthermore divides the flash mixing into two subtypes: deep mixing and shallow mixing. This has been shown by Sweigart et al. (2004), where the products with deep mixing are similar to those of the flash-mixing sdBs in our study, and those with shallow mixing are located in the gap between the flash-mixing sdBs and the canonical sdBs. Two models in our calculation, Mi = 1.0 M⊙, Mc = 0.456 M⊙ and Mi = 1.5 M⊙, Mc = 0.458 M⊙, are located in the gap (see Fig. 2). Their behaviour on the HRD is similar to that of the canonical sdBs in Fig. 3, except that the first He flash occurs when the stars have entered the WD cooling sequence but are still hot enough. The temporal evolution of the H- and He-burning luminosity and the convection region during the He flashes for the model of Mi = 1.0 M⊙, Mc = 0.456 M⊙ are presented in Fig. 6. The convection induced by the first He flash penetrates the H-rich envelope, but much later than in Fig. 4, which means that the penetration occurs when the first He flash is extinct. In this case, the H-rich material has not been involved in a high-temperature region to be consumed. In the following series of He flashes, the convection region never penetrates the H-rich envelope again. The products with shallow mixing then have a surface H abundance between that of deep mixing and that of the canonical sdBs, and remain in the gap between the two classes.
4. Discussions
4.1. Modelling the CE ejection process
We mimicked the CE ejection process using a very high mass-loss rate (10-3M⊙ yr-1) and stopped the ejection process when the star began to collapse. In other words, the radius of the star, R, is equal to the initial radius at the beginning of mass loss, R0. Although this modelling is physically reasonable, there is still a large uncertainty because of the lack of detailed dynamical simulations. The mass of the envelope, which is determined by the endpoint of the ejection process, is a key factor that can alter the properties of the produced sdBs, since it is related to the development of the convection region during the He flashes. The end of the CE ejection process is therefore very important here. In this subsection, we examine this by artificially fixing the remnant mass after the CE ejection process. To do this, the ejection process is stopped when the star has a mass equal to a specified value. The examined star has an initial mass of Mi = 1.0 M⊙ and a core mass of Mc = 0.446 M⊙ at the onset of the CE ejection. The produced sdB is a flash-mixing sdB with a mass of 0.453 M⊙ from our study in Sect. 3 (the standard model hereafter). Various stellar masses after the CE ejection process are adopted: MsdB = 0.452−0.472 M⊙ in steps of 0.002 M⊙. The results are shown in Fig. 7, where the products crowd at the hottest end of EHB when MsdB = 0.452−0.466 M⊙, and spread throughout the canonical sdB region when MsdB ≥ 0.468 M⊙. This means that the envelope mass (or the position at which the CE ejection terminates) determines the place of the produced sdBs on the Teff−log g diagram. Our study shows that for a given initial stellar mass and a given core mass at the onset of the CE, the star has a more massive envelope when the CE ejection stops earlier. The product is then more likely to be a canonical sdB, and the opposite holds when the CE ejection stops later.
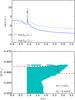 |
Fig. 6 Similar to Fig. 4, but for the first He and H flashes for the model of Mi = 1.0 M⊙, Mc = 0.456 M⊙. |
Very few sdB binaries with short orbital periods are located on or near the flashing-mixing sdB tracks, as described in Sect. 2. This suggests that the envelope mass after the CE ejection is probably more massive than that expected before. We here stopped the ejection when the donor contracted back into its Roche lobe, RL. The value of RL is ≈R0 at the onset of the CE and decreases with the ejection process. The assumption that the ejection ends as R<R0 is therefore an upper limit and gives the maximum envelope mass left on the remnant. For example, we could have obtained a lower envelope mass if we had replaced RL with the critical Roche-lobe radius of the remnant or the core radius before the CE ejection. Furthermore, Hall & Tout (2014) showed that the post-CE stripped remnant radius is smaller than that of the pre-CE core when the star is in HG or on RGB (Table 3 of that paper). This allows the companions to spiral in more closely to the core than before, and the envelope mass of the remnant decreases further if this is the case. A falling-back process, similar to the process that occurs in nova, probably occurs in the CE ejection and provides an appropriate way of increasing the envelope mass. The detailed process is beyond of the scope of this paper.
4.2. Mass loss during flashes
We did not include any mass-loss process except for the CE ejection for simplicity. However, the star obviously loses some material when it evolves on the RGB or during strong flashes. The stellar wind on the RGB may change some orbit parameters of sdB binaries such as the orbital period, but it probably does not affect the properties of the sdB stars, which are determined by the evolution after the envelope is stripped. The mass loss during the flashes will reduce the envelope mass of a pre-sdB star, then alters its final position on the Teff−log g diagram when stable He-core burning begins. There are two ways of mass loss during the flashes: a strong stellar wind driven by the violent flashes, and Roche lobe overflow when the pre-sdB star expands to exceed its Roche lobe radius. The effect of mass loss on the sdB mass is negligible since the mass loss is too small in comparison to MsdB, but the effect on the envelope mass may be significant since the envelope mass is itself very low. The mass loss is expected to be higher for the flash-mixing sdBs than for the canonical sdBs because of the additional strong H flash after the first He flash. For the flash-mixing sdBs, the surface He and C abundance presented in Table 1 may be further enhanced, but their locations on the Teff−log g diagram will not change much since these objects have nearly H-exhausted envelope. For the canonical sdBs, the mass loss reduces the envelope mass, and the tracks will move towards the lower left on the Teff−log g diagram. As a consequence, the sdBs immediately above the gap may change into flash-mixing or the shallow-mixing sdBs, while the upper right lines, where very few observational samples are located, will move downwards, which is better consistent with the observations.
4.3. Effect of metallicity
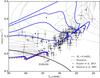 |
Fig. 7 Evolutionary tracks of the produced sdB stars from the star with an initial mass of 1.0 M⊙ and a core mass of 0.446 M⊙. The sdB mass, MsdB, is artificially set to be equal to 0.452, 0.454, ..., 0.472 and 0.474 M⊙ (in steps of 0.002 M⊙). The products crowd at the hottest end of EHB for MsdB = 0.452−0.466 M⊙ (located in the shaded region between the lowest two solid lines), and spread throughout the canonical sdB region when MsdB ≥ 0.468 M⊙ (from bottom to top, MsdB = 0.468,0.470,0.472, and 0.474 M⊙). The red dashed line shows the standard model (MsdB = 0.453 M⊙). SdBs with short orbital periods from Maxted et al. (2001) and Kupfer et al. (2015) are presented in the figure for comparison. The grey lines are the tracks during helium flashes before stable He-core burning. |
Properties of sdB stars produced from the CE ejection channel in our study.
Models investigated for a metallicity of Z = 0.004.
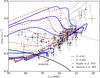 |
Fig. 8 Evolutionary tracks of the produced sdB stars on the Teff−log g diagram. The star has an initial mass of 1 M⊙ with a metallicity of Z = 0.004 (the dashed lines). The products crowd at the hottest end of EHB for the core mass Mc = 0.453−0.456 M⊙ (located in the shaded narrow region of the lowest two lines), and spread throughout the canonical sdB region when Mc ≥ 0.466 M⊙ (from bottom to top, Mc = 0.466,0.468,0.470, and 0.472 M⊙). The solid lines show the results of Z = 0.02 for the star with the same initial mass. The age difference between adjacent crosses is 107 yr. SdBs with short orbital periods from Maxted et al. (2001) and Kupfer et al. (2015) are presented in the figure for comparison. The grey lines are the tracks during helium flashes before stable He-core burning. |
All the studies above are for Population I stars (Z = 0.02). Here we show some models for Z = 0.004 to demonstrate the effect of metallicity on the final results. The star has an initial mass of 1.0 M⊙ and various core masses at the onset of the CE process (see Table 2). The results are shown in Fig. 8. They are very similar to those of Population I stars except for the exact positions on the Teff−log g diagram, that is, the produced sdBs appear as two groups, one group crowds at the hottest end of EHB (for Mc = 0.453−0.456 M⊙), and the other group spreads throughout the canonical sdB region (for Mc ≥ 0.466 M⊙). The whole tracks of Z = 0.004 move towards the lower left on the Teff−log g diagram, that is, sdBs with low initial metallicities have higher surface gravities (or smaller radii) and higher effective temperatures because of the lower opacity of the envelope during He-core burning. The luminosity of sdBs is mainly determined by the core mass during He-core burning. For Z = 0.004, the minimum core mass for He ignition at the first He flash is 0.460 M⊙ (Table 2), but it is 0.449 M⊙ for Z = 0.02 (Table 1). The flash-mixing sdB stars with Z = 0.004 are therefore more luminous than those with Z = 0.02. The study here suggests that the observed sdBs in the gap between the flash-mixing sdBs and the canonical sdBs can be well understood by adopting various metallicities.
4.4. He-rich sdB stars
Since He and C have been enhanced in the envelope during the flash mixing (see Table 1), the flash-mixing sdBs may be connected with the He-rich sdB stars. Figures 9 and 10 show comparisons of our models with observations in the Teff− [He/H] diagram and in the Teff− [C/H] diagram. The observed atmospheric parameters of sdBs are from Németh et al. (2012), who divided the sample into three types according to the ratio of He to H abundance, log (nHe/nH): H-rich if log (nHe/nH) < −0.349, intermediate He-rich if −0.349 ≤ log (nHe/nH) ≤ 0.6, and He-rich if log (nHe/nH) > 0.6. Figure 9 shows that the flash-mixing sdBs (the diamonds) have similar surface abundances as intermediate He-rich and He-rich sdB stars, while the canonical sdBs (the stars) are located near the boundary that separates the H-rich and intermediate He-rich sdBs. We note that with the evolving sdBs, the effective temperature increases and the surface He abundance probably reduces when the gravity setting is considered. The theoretical models then move left downwards, that is, the flash-mixing models may cross the intermediate He-rich and He-rich samples and the canonical models will cross the H-rich samples.
Figure 11 presents sdB samples on the Teff−log g diagram compared with theoretical evolutionary tracks. The figure shows that the intermediate He-rich and He-rich sdBs are indeed spread around the evolutionary tracks of flash-mixing models and also indicates that most of the (intermediate) He-rich stars can be well understood by the flash mixing (see also Miller Bertolami et al. 2008). In particular, the flash-mixing sdBs that originated from the CE ejection channel are on short-orbital periods and are probably responsible for (intermediate) He-rich sdBs with short orbital periods. However, only one intermediate He-rich sdB, CPD-20o1123, has been found on a short orbital period (Naslim et al. 2012), and its location on the Teff−log g diagram seems not relevant to the flash-mixing model. The lack of He-rich sdBs on short-orbital periods further indicates that the flash mixing does probably not occur in the products of the CE ejection. The reason for this probably is the relatively massive envelope mass, which in turn resulted from a falling-back process after the CE ejection, as discussed in Sect. 4.1.
4.5. Blue hook stars in GCs
Blue hook stars occupy a very blue position on the HB, but with a fainter luminosity than normal EHB stars. Their formation mechanism is not very clear. Brown et al. (2001) suggested that the late hot He flash, which occurs as the star descends the WD cooling curve, can reproduce such objects. The progenitors in the study of Brown and colleagues undergo unusually huge mass loss on the RGB, and the products are constructed based on some assumptions that are due to the numerical difficulties in dealing with the He flashes. Lei et al. (2015) reproduced the blue hook stars in NGC 2808 by employing tidally enhanced stellar wind in binaries. The evolutions after the mass loss are very similar to the evolution shown in this paper since the remnants have very similar structures regardless of how the the mass stripping occurs (CE ejection or strong stellar wind). Our study then provides a new way to forming the blue hook stars in GCs. Furthermore, sdB stars from stable mass transfer may also have similar processes if the envelope mass is low enough. The flash mixing is crucial in all of the suggested formation channels and leads to similar observational properties for the blue hook stars themselves. The hints of their origins probably exist in the orbital parameters, such as the orbital period if they were in binaries.
4.6. Comparison with sdBs with long orbital periods
Using MESA, Vos et al. (2015) and Lei et al. (2015, 2016) obtained several sdBs with long orbital periods through stable mass transfer or tidally enhanced stellar wind. These sdBs with long orbital periods are also divided into three classes: flash-mixing sdBs, shallow-mixing sdBs, and canonical sdBs. However, we did not find any discussions on the numbers of the shallow-mixing sdBs. On the other hand, we found relatively broad orbital period ranges for sdBs with late flashes (to produce the flash-mixing and the shallow mixing sdBs) in Lei et al. (2016). Based on our results, which are that the envelope mass of the pre-sdBs determines the properties of the sdB stars and that the envelope mass range for the shallow-mixing sdBs is very narrow, most of the products from the models in the orbital period ranges for late flashes may be the flash-mixing sdBs and not the shallow-mixing sdBs. If a large portion of the produced sdBs in the orbital period ranges for late flashes are shallow mixing, the tidally enhanced wind is then very favourable for forming sdBs with an envelope mass exactly in the range for the shallow-mixing sdBs.
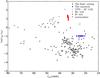 |
Fig. 9 Ratio of He to H abundance at the surface related to the solar value, [He/H], versus effective temperature, for our theoretical models and the observations. The sdB samples are from Németh et al. (2012) and have been divided into three types, i.e. H-rich, intermediate He-rich, and He-rich, as indicated in the figure. The diamonds are for the flash-mixing sdBs and the stars are for the canonical sdBs, where the He and H abundances are chosen at the onset of stable helium-core burning. The cross stands for CPD-20o1123, an intermediate He-rich sdB with an orbital period of 2.3698 d (Naslim et al. 2012). |
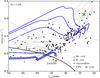 |
Fig. 11 Evolutionary tracks of the produced sdBs and the sdB samples with atmospheric He abundance (Németh et al. 2012) on the effective temperature-gravity diagram. The shaded area between the lowest two lines is the region of the evolutionary tracks that are occupied by the flash-mixing models. The age difference between adjacent crosses on the evolutionary tracks is 107 yr. The cross stands for CPD-20o1123, an intermediate He-rich sdB with an orbital period of 2.3698 d (Naslim et al. 2012). The grey lines are the tracks during helium flashes before stable He-core burning. |
5. Conclusions
Employing the code MESA, we studied the properties of sdBs produced from the CE channel. The stars appear as two distinct groups on the Teff−log g diagram: the flash-mixing sdBs, and the canonical sdBs, as defined in this paper. The flash-mixing sdBs have almost no H-rich envelope and are crowded at the hottest temperature end of EHB, while the canonical sdBs have a significant H-rich envelope and are spread throughout the entire canonical EHB region.
The key factor for the dichotomy of the sdB properties is the extent of convection during the first helium flash. For the flash-mixing sdBs, the star enters the CE process earlier and has a lower He core mass. The first helium flash occurs when the star descends the WD cooling curve and is followed by a violent hydrogen flash, which is triggered by convective element mixing between H-rich envelope and He-burning region. Hydrogen in the envelope is then almost exhausted and the products are almost naked He cores. For the canonical sdBs, the star enters the CE process later and has a more massive He core. The first helium flash occurs much earlier, and the convection induced by the helium flash never penetrates the H-rich envelope because of the high entropy barrier of H-rich envelope. The products then remain significant H-rich envelope and are spread throughout the entire canonical EHB region. Their positions are determined by the H-rich envelope mass as studied in many previous works. Therefore, the dichotomy of the sdB properties from the CE ejection channel is intrinsic and caused by the interior structure of the star after the CE ejection.
The treatment of convection and the modelling of the CE ejection process will greatly change the parameter spaces for the two typical groups of sdB stars. For a given initial stellar mass and a given core mass at the onset of the CE, the star will be more massive and have a more-massive envelope if the CE ejection stops earlier. The produced sdB is more likely to be a canonical sdB, and the opposite holds for later ejection. The fact that very few short-orbital period sdB binaries are located in the flash-mixing sdB region means that the sdBs produced from the CE ejection have a more massive envelope mass than expected. The lack of He-rich sdBs with short orbital periods also indicates that the flash mixing is rare in the products of the CE ejection. A falling-back process after the CE ejection, similar to what occurs in nova, is an appropriate way of increasing the envelope mass, then prevents the flash mixing.
The effective temperature at the transition between the two groups decreases discontinuously, leaving a gap on the Teff−log g diagram. Only two products are found to be in the gap from our model grid. The properties of the two models are consistent with the properties of shallow mixing (mixing is incomplete) and can well explain the blue hook stars in NGC 2808. Various formation scenarios for blue hook stars give similar characteristics of these objects, and hints of their origins probably exist in the orbital parameters if they were in binaries.
Acknowledgments
This work is supported by the Natural Science Foundation of China (Nos. 11422324, 11521303, 11390374), by Yunnan province (Nos. 2012HB037, 2013HA005) and by the Chinese Academy of Sciences (No. KJZD-EW-M06-01).
References
- Altmann, M., Edelmann, H., & de Boer, K. S. 2004, A&A, 414, 181 [NASA ADS] [CrossRef] [EDP Sciences] [Google Scholar]
- Barlow, B., Wade, R. A., & Liss, S. 2013, in AAS Meeting Abstracts, 221, 142.17 [Google Scholar]
- Brown, T. M., Bowers, C. W., Kimble, R. A., Sweigart, A. V., & Ferguson, H. C. 2000, ApJ, 532, 308 [NASA ADS] [CrossRef] [Google Scholar]
- Brown, T. M., Sweigart, A. V., Lanz, T., Landsman, W. B., & Hubeny, I. 2001, ApJ, 562, 368 [NASA ADS] [CrossRef] [Google Scholar]
- Castellani, M., & Castellani, V. 1993, ApJ, 407, 649 [NASA ADS] [CrossRef] [Google Scholar]
- Charpinet, S., Green, E. M., Baglin, A., et al. 2010, A&A, 516, L6 [NASA ADS] [CrossRef] [EDP Sciences] [Google Scholar]
- Chen, X., Han, Z., Deca, J., & Podsiadlowski, P. 2013, MNRAS, 434, 186 [NASA ADS] [CrossRef] [Google Scholar]
- Copperwheat, C. M., Morales-Rueda, L., Marsh, T. R., Maxted, P. F. L., & Heber, U. 2011, MNRAS, 415, 1381 [NASA ADS] [CrossRef] [Google Scholar]
- D’Cruz, N. L., Dorman, B., Rood, R. T., & O’Connell, R. W. 1996, ApJ, 466, 359 [NASA ADS] [CrossRef] [Google Scholar]
- Ferguson, H. C., Davidsen, A. F., Kriss, G. A., et al. 1991, ApJ, 382, L69 [NASA ADS] [CrossRef] [Google Scholar]
- Hall, P. D., & Tout, C. A. 2014, MNRAS, 444, 3209 [NASA ADS] [CrossRef] [Google Scholar]
- Han, Z. 2008, A&A, 484, L31 [NASA ADS] [CrossRef] [EDP Sciences] [Google Scholar]
- Han, Z., Podsiadlowski, P., Maxted, P. F. L., Marsh, T. R., & Ivanova, N. 2002, MNRAS, 336, 449 [NASA ADS] [CrossRef] [Google Scholar]
- Han, Z., Podsiadlowski, P., Maxted, P. F. L., & Marsh, T. R. 2003, MNRAS, 341, 669 [NASA ADS] [CrossRef] [Google Scholar]
- Han, Z., Podsiadlowski, P., & Lynas-Gray, A. E. 2007, MNRAS, 380, 1098 [NASA ADS] [CrossRef] [Google Scholar]
- Heber, U. 2009, ARA&A, 47, 211 [NASA ADS] [CrossRef] [Google Scholar]
- Heber, U. 2016, PASP, 128, 082001 [NASA ADS] [CrossRef] [Google Scholar]
- Iben, Jr., I. 1984, ApJ, 277, 333 [NASA ADS] [CrossRef] [Google Scholar]
- Ivanova, N., Justham, S., Chen, X., et al. 2013, A&ARv, 21, 59 [Google Scholar]
- Jeffery, C. S., & Pollacco, D. L. 1998, MNRAS, 298, 179 [NASA ADS] [CrossRef] [Google Scholar]
- Koen, C., Orosz, J. A., & Wade, R. A. 1998, MNRAS, 300, 695 [NASA ADS] [CrossRef] [Google Scholar]
- Kupfer, T., Geier, S., Heber, U., et al. 2015, VizieR Online Data Catalog: III/57 [Google Scholar]
- Lanz, T., Brown, T. M., Sweigart, A. V., Hubeny, I., & Landsman, W. B. 2004, ApJ, 602, 342 [NASA ADS] [CrossRef] [Google Scholar]
- Lei, Z., Chen, X., Zhang, F., & Han, Z. 2015, MNRAS, 449, 2741 [NASA ADS] [CrossRef] [Google Scholar]
- Lei, Z., Zhao, G., Zeng, A., et al. 2016, MNRAS, 463, 3449 [NASA ADS] [CrossRef] [Google Scholar]
- Maxted, P. F. L., Marsh, T. R., & North, R. C. 2000a, MNRAS, 317, L41 [NASA ADS] [CrossRef] [Google Scholar]
- Maxted, P. F. L., Moran, C. K. J., Marsh, T. R., & Gatti, A. A. 2000b, MNRAS, 311, 877 [NASA ADS] [CrossRef] [Google Scholar]
- Maxted, P. F. L., Heber, U., Marsh, T. R., & North, R. C. 2001, MNRAS, 326, 1391 [NASA ADS] [CrossRef] [Google Scholar]
- Miller Bertolami, M. M., Althaus, L. G., Unglaub, K., & Weiss, A. 2008, A&A, 491, 253 [NASA ADS] [CrossRef] [EDP Sciences] [Google Scholar]
- Moran, C., Maxted, P., Marsh, T. R., Saffer, R. A., & Livio, M. 1999, MNRAS, 304, 535 [NASA ADS] [CrossRef] [Google Scholar]
- Napiwotzki, R., Karl, C. A., Lisker, T., et al. 2004, Ap&SS, 291, 321 [NASA ADS] [CrossRef] [Google Scholar]
- Naslim, N., Geier, S., Jeffery, C. S., et al. 2012, MNRAS, 423, 3031 [NASA ADS] [CrossRef] [Google Scholar]
- Németh, P., Kawka, A., & Vennes, S. 2012, MNRAS, 427, 2180 [NASA ADS] [CrossRef] [Google Scholar]
- Orosz, J. A., & Wade, R. A. 1999, MNRAS, 310, 773 [NASA ADS] [CrossRef] [Google Scholar]
- Paxton, B., Bildsten, L., Dotter, A., et al. 2011, ApJS, 192, 3 [Google Scholar]
- Paxton, B., Cantiello, M., Arras, P., et al. 2013, ApJS, 208, 4 [NASA ADS] [CrossRef] [Google Scholar]
- Paxton, B., Marchant, P., Schwab, J., et al. 2015, ApJS, 220, 15 [Google Scholar]
- Saffer, R. A., Livio, M., & Yungelson, L. R. 1998, ApJ, 502, 394 [NASA ADS] [CrossRef] [Google Scholar]
- Schindler, J.-T., Green, E. M., & Arnett, W. D. 2015, ApJ, 806, 178 [NASA ADS] [CrossRef] [Google Scholar]
- Sweigart, A. V., Lanz, T., Brown, T. M., Hubeny, I., & Landsman, W. B. 2004, Ap&SS, 291, 367 [NASA ADS] [CrossRef] [Google Scholar]
- Vos, J., Østensen, R. H., Marchant, P., & Van Winckel, H. 2015, A&A, 579, A49 [NASA ADS] [CrossRef] [EDP Sciences] [Google Scholar]
- Wang, B., & Han, Z. 2009, A&A, 508, L27 [NASA ADS] [CrossRef] [EDP Sciences] [Google Scholar]
All Tables
All Figures
|
Fig. 1 Evolutionary tracks on the Hertzsprung-Russell diagram for the four stars studied in the paper. The X and the filled dot mark the positions where the star fills its Roche lobe and begins the CE evolution. The X shows stars with a strong H flash after the main He flash and the filled dots stars without such a strong H flash (see text for details). |
| In the text | |
|
Fig. 2 Evolutionary tracks of the produced sdB stars on the effective temperature-gravity (Teff−log g) diagram. Initial stellar mass, Mi, and the position of zero-age helium main sequence (ZAHeMS, the thick-solid line) are indicated. The shaded area between the lowest two lines in each panel shows the region of the evolutionary tracks of the flash-mixing models (see the text for details) for clarity. The age difference between adjacent crosses is 107 yr. The dots and diamonds are sdBs with short orbital periods from Maxted et al. (2001), Kupfer et al. (2015), respectively. The grey lines are the tracks during helium flashes before stable He-core burning. |
| In the text | |
|
Fig. 3 Typical evolutionary tracks (starting from the end of the CE ejection) for the two groups of sdBs produced from the CE ejection channel. The two models have the same initial masses (Mi = 0.8 M⊙), but different core masses at the onset of the CE ejection, that is, Mc = 0.448 M⊙ for that of the flash-mixing sdB (the dashed line) and 0.458 M⊙ for that of the canonical sdB (the solid line), respectively. The plus and the filled dot show the positions where the first He and H flash occur, respectively. |
| In the text | |
|
Fig. 4 Temporal evolution of the H- and He-burning luminosity (upper panels) and the structure of convection region (the shaped region) near the surface (bottom panels) during the flashes. The model has Mi = 0.8 M⊙ and Mc = 0.448 M⊙ at the onset of the CE ejection. The plus and the filled dot show the positions where the first He and H flash occur, respectively (see Fig. 3). The dashed line in the bottom panels is the boundary of the H-rich envelope, that is, the H mass abundance of XH = 0.1. The convection developed during the first He flash penetrates the H-rich envelope, resulting in an additional very strong H flash. The right two panels zoom in on the first He and H flashes. |
| In the text | |
|
Fig. 5 Similar to Fig. 4, but for Mi = 0.8 M⊙, Mc = 0.458 M⊙. The convection developed during the He flashes never penetrates the H-rich envelope, and the strong H flash of Fig. 4 fails to appear here. |
| In the text | |
|
Fig. 6 Similar to Fig. 4, but for the first He and H flashes for the model of Mi = 1.0 M⊙, Mc = 0.456 M⊙. |
| In the text | |
|
Fig. 7 Evolutionary tracks of the produced sdB stars from the star with an initial mass of 1.0 M⊙ and a core mass of 0.446 M⊙. The sdB mass, MsdB, is artificially set to be equal to 0.452, 0.454, ..., 0.472 and 0.474 M⊙ (in steps of 0.002 M⊙). The products crowd at the hottest end of EHB for MsdB = 0.452−0.466 M⊙ (located in the shaded region between the lowest two solid lines), and spread throughout the canonical sdB region when MsdB ≥ 0.468 M⊙ (from bottom to top, MsdB = 0.468,0.470,0.472, and 0.474 M⊙). The red dashed line shows the standard model (MsdB = 0.453 M⊙). SdBs with short orbital periods from Maxted et al. (2001) and Kupfer et al. (2015) are presented in the figure for comparison. The grey lines are the tracks during helium flashes before stable He-core burning. |
| In the text | |
|
Fig. 8 Evolutionary tracks of the produced sdB stars on the Teff−log g diagram. The star has an initial mass of 1 M⊙ with a metallicity of Z = 0.004 (the dashed lines). The products crowd at the hottest end of EHB for the core mass Mc = 0.453−0.456 M⊙ (located in the shaded narrow region of the lowest two lines), and spread throughout the canonical sdB region when Mc ≥ 0.466 M⊙ (from bottom to top, Mc = 0.466,0.468,0.470, and 0.472 M⊙). The solid lines show the results of Z = 0.02 for the star with the same initial mass. The age difference between adjacent crosses is 107 yr. SdBs with short orbital periods from Maxted et al. (2001) and Kupfer et al. (2015) are presented in the figure for comparison. The grey lines are the tracks during helium flashes before stable He-core burning. |
| In the text | |
|
Fig. 9 Ratio of He to H abundance at the surface related to the solar value, [He/H], versus effective temperature, for our theoretical models and the observations. The sdB samples are from Németh et al. (2012) and have been divided into three types, i.e. H-rich, intermediate He-rich, and He-rich, as indicated in the figure. The diamonds are for the flash-mixing sdBs and the stars are for the canonical sdBs, where the He and H abundances are chosen at the onset of stable helium-core burning. The cross stands for CPD-20o1123, an intermediate He-rich sdB with an orbital period of 2.3698 d (Naslim et al. 2012). |
| In the text | |
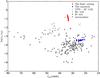 |
Fig. 10 Similar to Fig. 9, but for [C/H]. |
| In the text | |
|
Fig. 11 Evolutionary tracks of the produced sdBs and the sdB samples with atmospheric He abundance (Németh et al. 2012) on the effective temperature-gravity diagram. The shaded area between the lowest two lines is the region of the evolutionary tracks that are occupied by the flash-mixing models. The age difference between adjacent crosses on the evolutionary tracks is 107 yr. The cross stands for CPD-20o1123, an intermediate He-rich sdB with an orbital period of 2.3698 d (Naslim et al. 2012). The grey lines are the tracks during helium flashes before stable He-core burning. |
| In the text | |
Current usage metrics show cumulative count of Article Views (full-text article views including HTML views, PDF and ePub downloads, according to the available data) and Abstracts Views on Vision4Press platform.
Data correspond to usage on the plateform after 2015. The current usage metrics is available 48-96 hours after online publication and is updated daily on week days.
Initial download of the metrics may take a while.