Fig. 4
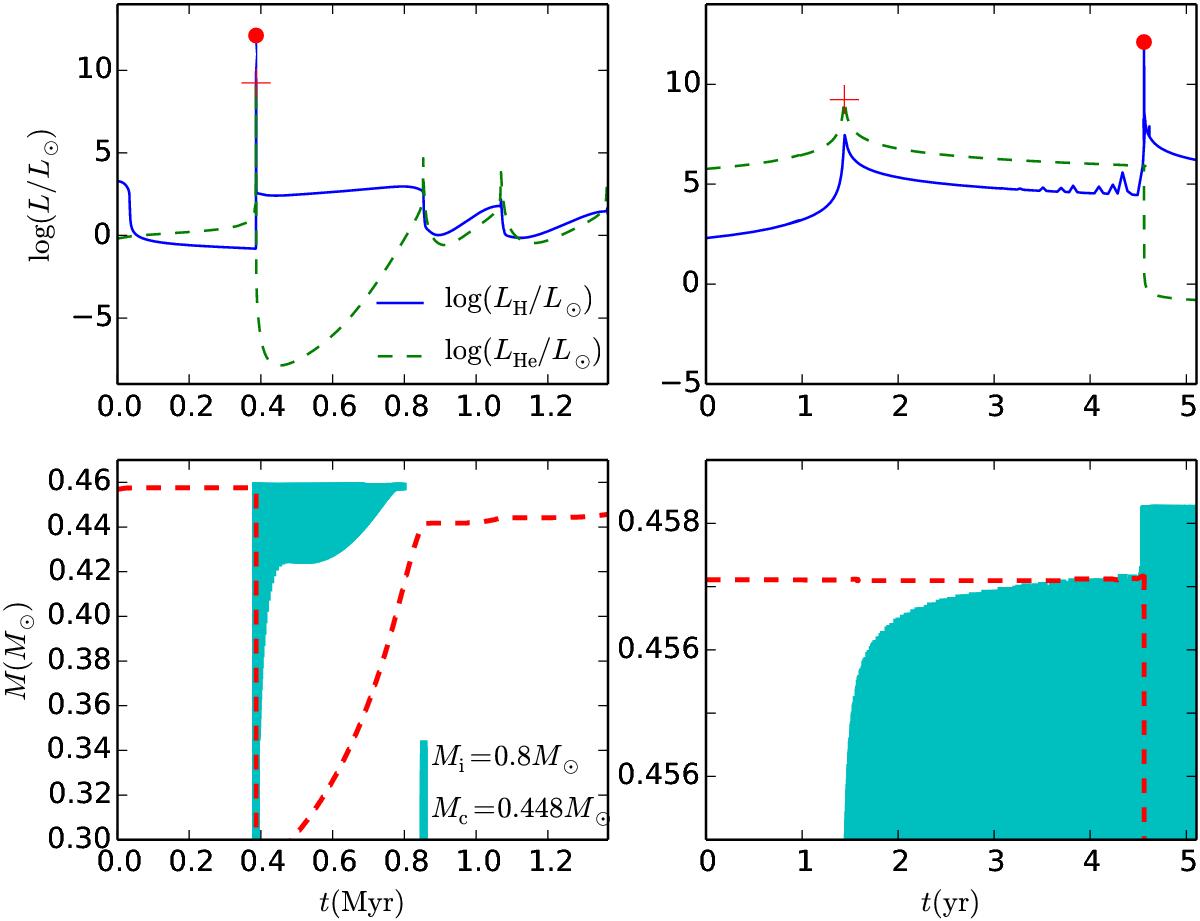
Temporal evolution of the H- and He-burning luminosity (upper panels) and the structure of convection region (the shaped region) near the surface (bottom panels) during the flashes. The model has Mi = 0.8 M⊙ and Mc = 0.448 M⊙ at the onset of the CE ejection. The plus and the filled dot show the positions where the first He and H flash occur, respectively (see Fig. 3). The dashed line in the bottom panels is the boundary of the H-rich envelope, that is, the H mass abundance of XH = 0.1. The convection developed during the first He flash penetrates the H-rich envelope, resulting in an additional very strong H flash. The right two panels zoom in on the first He and H flashes.
Current usage metrics show cumulative count of Article Views (full-text article views including HTML views, PDF and ePub downloads, according to the available data) and Abstracts Views on Vision4Press platform.
Data correspond to usage on the plateform after 2015. The current usage metrics is available 48-96 hours after online publication and is updated daily on week days.
Initial download of the metrics may take a while.