Fig. 3
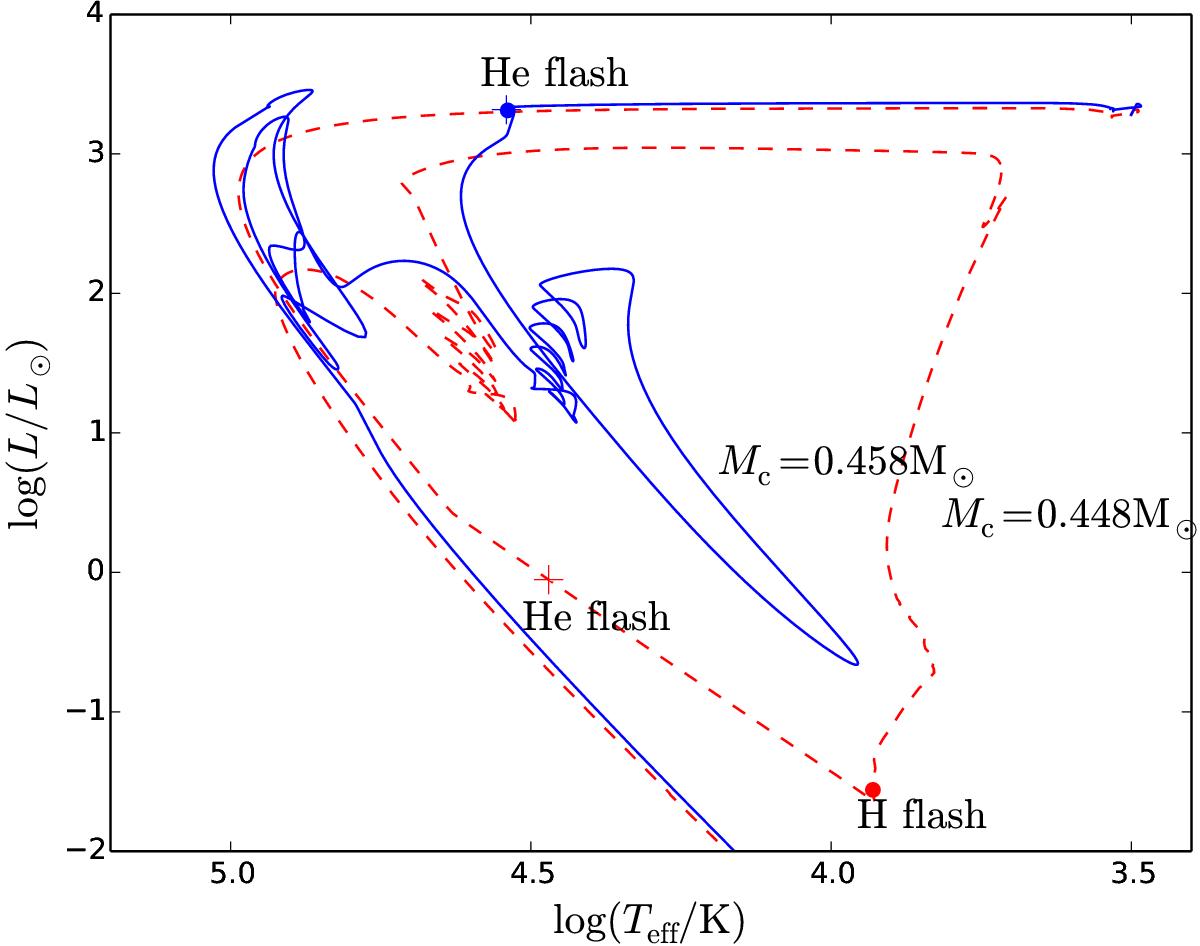
Typical evolutionary tracks (starting from the end of the CE ejection) for the two groups of sdBs produced from the CE ejection channel. The two models have the same initial masses (Mi = 0.8 M⊙), but different core masses at the onset of the CE ejection, that is, Mc = 0.448 M⊙ for that of the flash-mixing sdB (the dashed line) and 0.458 M⊙ for that of the canonical sdB (the solid line), respectively. The plus and the filled dot show the positions where the first He and H flash occur, respectively.
Current usage metrics show cumulative count of Article Views (full-text article views including HTML views, PDF and ePub downloads, according to the available data) and Abstracts Views on Vision4Press platform.
Data correspond to usage on the plateform after 2015. The current usage metrics is available 48-96 hours after online publication and is updated daily on week days.
Initial download of the metrics may take a while.