Fig. 2
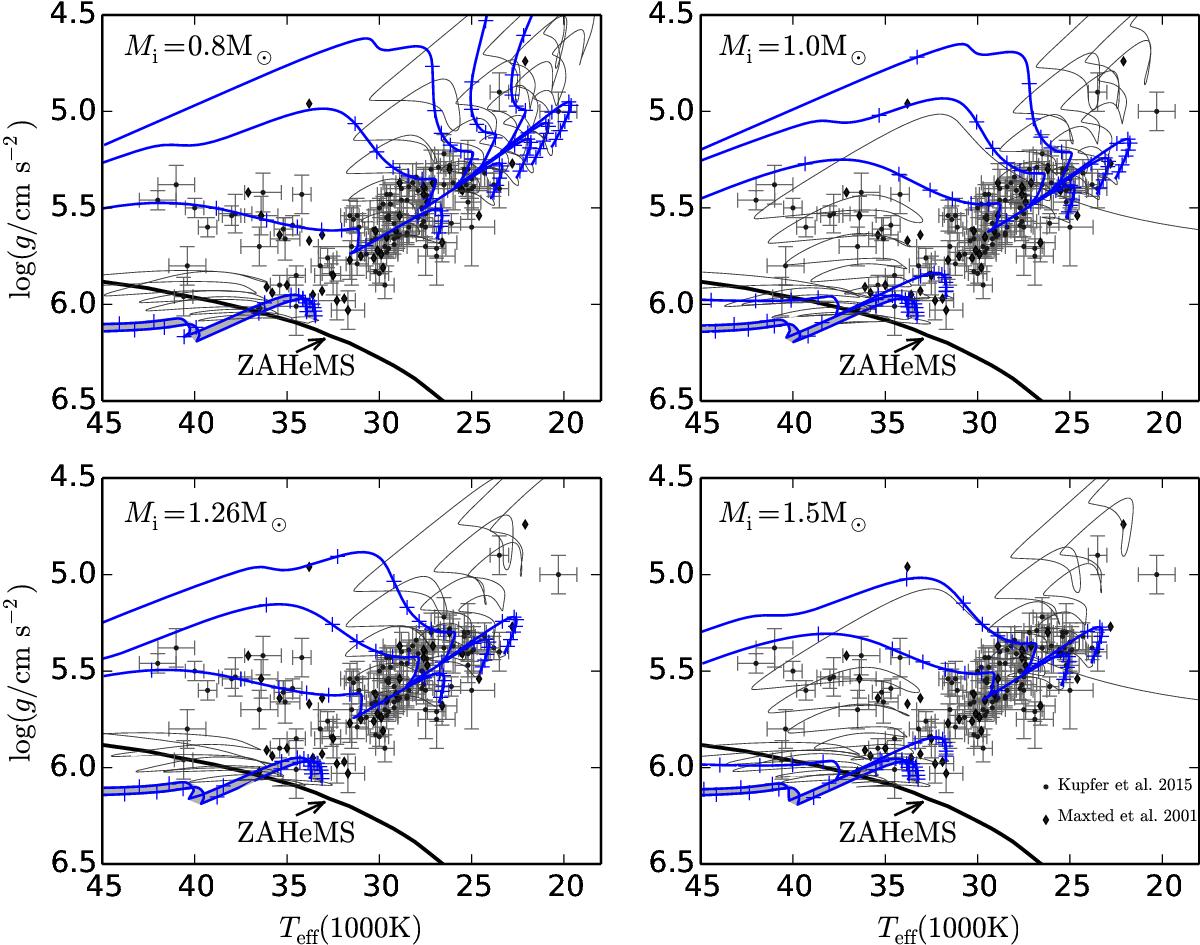
Evolutionary tracks of the produced sdB stars on the effective temperature-gravity (Teff−log g) diagram. Initial stellar mass, Mi, and the position of zero-age helium main sequence (ZAHeMS, the thick-solid line) are indicated. The shaded area between the lowest two lines in each panel shows the region of the evolutionary tracks of the flash-mixing models (see the text for details) for clarity. The age difference between adjacent crosses is 107 yr. The dots and diamonds are sdBs with short orbital periods from Maxted et al. (2001), Kupfer et al. (2015), respectively. The grey lines are the tracks during helium flashes before stable He-core burning.
Current usage metrics show cumulative count of Article Views (full-text article views including HTML views, PDF and ePub downloads, according to the available data) and Abstracts Views on Vision4Press platform.
Data correspond to usage on the plateform after 2015. The current usage metrics is available 48-96 hours after online publication and is updated daily on week days.
Initial download of the metrics may take a while.