| Issue |
A&A
Volume 580, August 2015
|
|
|---|---|---|
| Article Number | L15 | |
| Number of page(s) | 6 | |
| Section | Letters | |
| DOI | https://doi.org/10.1051/0004-6361/201526902 | |
| Published online | 20 August 2015 | |
A supernova distance to the anchor galaxy NGC 4258⋆
1
Astrophysics Research Centre, School of Mathematics and Physics, Queen’s
University Belfast,
Belfast
BT7 1NN,
UK
e-mail:
jpolshaw01@qub.ac.uk
2
Institute for Astronomy, University of Hawaii,
2680 Woodlawn Drive,
Honolulu, HI
96822,
USA
3
European Southern Observatory, Karl-Schwarzschild-Str. 2, 85748
Garching bei München,
Germany
4
Max-Planck-Institut fur Astrophysik, Karl-Schwarzschild-Str. 1, 85748
Garching bei München,
Germany
5
The Oskar Klein Centre & Department of Astronomy,
Stockholm University, AlbaNova, 106
91
Stockholm,
Sweden
Received: 6 July 2015
Accepted: 3 August 2015
The fortuitous occurrence of a type II-Plateau (IIP) supernova, SN 2014bc, in a galaxy for which distance estimates from a number of primary distance indicators are available provides a means with which to cross-calibrate the standardised candle method (SCM) for type IIP SNe. By applying calibrations from the literature we find distance estimates in line with the most precise measurement to NGC 4258 based on the Keplerian motion of masers (7.6 ± 0.23 Mpc), albeit with significant scatter. We provide an alternative local SCM calibration by only considering type IIP SNe that have occurred in galaxies for which a Cepheid distance estimate is available. We find a considerable reduction in scatter (σI = 0.16 mag), but note that the current sample size is limited. Applying this calibration, we estimate a distance to NGC 4258 of 7.08 ± 0.86 Mpc.
Key words: supernovae: general / supernovae: individual: SN 2014bc / distance scale / galaxies: individual: NGC 4258
Appendix A is available in electronic form at http://www.aanda.org
© ESO, 2015
1. Introduction
Although the use of thermonuclear (type Ia) supernovae (SNe) as standardisable candles is now firmly embedded within the fabric of mainstream cosmology, consideration of other types of SNe as either relative or absolute distance indicators is still in its infancy. The reasons for this are manifold, ranging from overall faintness at epochs of interest (e.g. type IIP SNe; Hamuy & Pinto 2002; Nugent et al. 2006), to a current lack of comparable precision when compared to SNe Ia (e.g. GRB-SNe; Cano & Jakobsson 2014; Li et al. 2014) or superluminous SNe (Inserra & Smartt 2014). Of the non-type Ia SNe, arguably the most promising avenue is afforded by the type IIP SNe, as their relative faintness is amply compensated by their higher frequency per unit volume, while the tight correlation between ejecta velocity and plateau brightness (“standardised candle method”, hereafter SCM; Hamuy & Pinto 2002) rests on physically-motivated, and well-understood grounds.
The local distance scale hinges primarily on the calibration of the Cepheid period-luminosity (P − L) relation to the Large Magellanic Cloud (LMC) distance. Although no effort has been spared in attempting to quantify the systematic effects that affect the P − L relation, (e.g. Freedman et al. 2001; Fausnaugh et al. 2015), the suitability of LMC as the first rung on the cosmological distance ladder has itself been called into question (e.g. Macri et al. 2006; Riess et al. 2011). NGC 4258 is a natural choice for anchoring the Cepheid distance scale as a geometric maser distance with an uncertainty of only 3% has been measured (7.6 ± 0.23 Mpc; Humphreys et al. 2013).
In this Letter, we use SN 2014bc to obtain the distance to NGC 4258, the only galaxy for which both maser and Cepheid distance measurements are available.
2. Observations
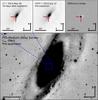 |
Fig. 1 Top: r′-band image of SN 2014bc
(left), pre-explosion image (middle), and the
difference between the two (right). SN 2014bc is located at
αJ2000 =
12:18:57.71, δJ2000 = + 47:18:11.3, projected
|
SN 2014bc in NGC 4258 was discovered by the Panoramic Survey Telescope and Rapid Response System 1 (PS1; Kaiser et al. 2010) on 2014 May 19.25 (Smartt et al. 2014). However, upon further inspection, the first PS1 detection was in fact on 2014 Apr. 11.40, when NGC 4258 was serendipitously observed during the PS1 NEO survey. The Lick Observatory Supernova Search (LOSS) subsequently reported an earlier detection on 2014 Apr. 9.35 (Zheng & Filippenko 2014), although they do not give a precise magnitude due to the proximity of the SN to the bright nucleus of NGC 4258 (see Fig. 1). Nevertheless, LOSS did report a non-detection on 2014 Apr. 6.35 at R> + 18.0 mag., allowing us to constrain the explosion epoch to 2014 Apr. 7.9 ± 1.5 (MJD = 56 754.9 ± 1.5), which we will hereafter refer to as day 0. An optical spectrum obtained 2 d after discovery (+43.9 d) revealed the object to be a type-II SN (Ochner et al. 2014).
We obtained followup optical imaging of the SN using a combination of the 2 m Liverpool
Telescope (LT) in the g′r′i′z′
filters, and PS1 in the gPS1 rPS1 iPS1 zPS1 yPS1
filters. The images were reduced in a standard fashion by the LT and PS1 Image Processing
Pipelines (IPP; Magnier et al. 2013), respectively.
The griz
zeropoints and colour terms were measured using a sequence of stars in the SDSS DR9
catalogue, while the PS1 zeropoints were computed by the IPP and taken from the images
(Schlafly et al. 2012; Magnier et al. 2013). As SN 2014bc is located just
 from the bright nucleus of NGC 4258
(Fig. 1), direct measurements of the SN brightness were
rendered difficult. We therefore subtracted archival pre-explosion images from each followup
optical image using hotpants1. For the LT
g,r, and
i data we
used images taken by the Canada France Hawaii Telescope (CFHT) taken on 2005 Apr. 06, 2013
Jul. 12 and 2009 Feb. 26 respectively. For the LT z-band we used the SDSS image of the field (taken on
2002 Dec. 13); for the PS1 data we used the Medium-Deep Survey stacks (Tonry et al. 2012a). An example of template subtraction is shown in the
upper panels of Fig. 1. The magnitude of the SN in the
difference image was measured via PSF-fitting using the SNOoPY2 package within iraf. The photometry of SN 2014bc is given in Table
A.1, and the light curves are shown in the top
panel of Fig. 2.
from the bright nucleus of NGC 4258
(Fig. 1), direct measurements of the SN brightness were
rendered difficult. We therefore subtracted archival pre-explosion images from each followup
optical image using hotpants1. For the LT
g,r, and
i data we
used images taken by the Canada France Hawaii Telescope (CFHT) taken on 2005 Apr. 06, 2013
Jul. 12 and 2009 Feb. 26 respectively. For the LT z-band we used the SDSS image of the field (taken on
2002 Dec. 13); for the PS1 data we used the Medium-Deep Survey stacks (Tonry et al. 2012a). An example of template subtraction is shown in the
upper panels of Fig. 1. The magnitude of the SN in the
difference image was measured via PSF-fitting using the SNOoPY2 package within iraf. The photometry of SN 2014bc is given in Table
A.1, and the light curves are shown in the top
panel of Fig. 2.
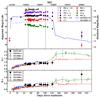 |
Fig. 2 Top: light curves of SN 2014bc, corrected for Galactic reddening. The absolute magnitude scale was determined using μ = 29.4 mag. The R-band light curves of the type IIP SNe 1999br and 2005cs are shown according to the absolute magnitude scale. Downward pointing arrows indicate limiting magnitudes. The vertical dashed lines indicate the spectroscopic epochs of SN 2014bc. Small differences between the SDSS and PS1 photometric systems are evident (Tonry et al. 2012b). Middle and bottom: colours of SNe 2014bc compared to SNe 1999br, 2005cs, and 1999em. |
We obtained an optical spectrum of the SN at +52 d with the Gran Telescopio Canarias +
OSIRIS. The R300B grism was used with a slit width of
 , and a total exposure time of 525 s over
four separate exposures, which led to a wavelength range of 4400−10 000 Å at a resolution of 17.4 Å as measured from the FWHM of the
[O i] λ5577 Å sky line (average of all exposures). The spectrum was reduced using
standard techniques, with relative flux calibration performed using the spectrophotometric
standard star GD 153, and an absolute scaling achieved from coeval photometry. This spectrum
is presented in Fig. 3. We also obtained a spectrum on
day 102 with the R1000B grism and a
, and a total exposure time of 525 s over
four separate exposures, which led to a wavelength range of 4400−10 000 Å at a resolution of 17.4 Å as measured from the FWHM of the
[O i] λ5577 Å sky line (average of all exposures). The spectrum was reduced using
standard techniques, with relative flux calibration performed using the spectrophotometric
standard star GD 153, and an absolute scaling achieved from coeval photometry. This spectrum
is presented in Fig. 3. We also obtained a spectrum on
day 102 with the R1000B grism and a  slit that yielded a resolution of
9.4 Å. Both spectra were taken
with identical slit position-angles, and aligned so as to minimize contamination from the
bright nucleus of NGC 4258.
slit that yielded a resolution of
9.4 Å. Both spectra were taken
with identical slit position-angles, and aligned so as to minimize contamination from the
bright nucleus of NGC 4258.
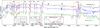 |
Fig. 3 Optical spectra of SNe 2014bc, 1999br, and 2005cs, all at approximately 50 d after explosion. The spectra have been corrected for reddening and redshift. The ⊕ symbol indicates significant telluric absorption. Insets a) and b) show zoom-ins of the Fe ii λ5169 and Na i D regions respectively. Inset c) shows a zoom-in of the higher resolution 102 d spectrum of SN 2014bc. The rest wavelengths of Fe ii λ5169, Ba ii λ5854 and the Na i λλ5890, 5896 doublet are marked by vertical red lines in the inset panels. |
2.1. Reddening estimate and absolute magnitudes
The Galactic reddening in the line of sight to SN 2014bc is E(B − V) = 0.0141 mag (Schlafly & Finkbeiner 2011). In order to estimate the host galaxy reddening, we consider the colour evolution, spectral shape, and search for narrow Na i D absorption. For type IIP SNe, it is reasonable to assume that the photospheric temperature should not drop below the hydrogen recombination temperature during the plateau phase. Although the actual composition will play a role, to zeroth order all type IIP SNe should evolve through the same colour at the end of the plateau (Eastman et al. 1996; Hamuy 2003a). In the middle and lower panels of Fig. 2, we compare the colour evolution of SN 2014bc to other II-P SNe. We find that the SN 2014bc colours – only corrected for Galactic reddening – closely track those of SNe 1999br, 1999em, and 2005cs, which were inferred to have a total E(B − V) of 0.024, 0.1, and 0.05 mag., respectively (Pastorello et al. 2004, 2009; Elmhamdi et al. 2003). Our photometric coverage of SN 2014bc does not extend to the transition off the plateau phase given that it was reaching conjunction with the sun at that epoch. Nevertheless, if we assume that our set of points at 122 d are at, or close to the end of the plateau, then the colours are entirely consistent with other, virtually unreddened type II-P SNe, which have observations that do continue beyond the end of the recombination phase.
Another commonly-used technique to estimate the host galaxy reddening in SNe is to measure the equivalent widths of the narrow interstellar absorption lines due to Na i D (e.g. Turatto et al. 2003). We do not detect narrow Na i lines in any of our spectra at the redshift of NGC 4258 (see insets in Fig. 3), including our highest resolution spectrum (9.4 Å). This implies little to no reddening due to the interstellar medium of the host galaxy. Ochner et al. (2014) report narrow Na i lines in their admittedly low signal-to-noise and heavily contaminated classification spectrum taken only 8 d prior to our first spectrum. Upon inspection of this publicly available spectrum via the Asiago Transient Classification Programme, we speculate that this might be attributable to differences in the slit positioning, seeing, and spatial resolution.
Examining all the evidence in hand, we note that the colour evolution of SN 2014bc during the plateau is completely consistent with other type IIP SNe, while the absolute magnitudes are intermediate between those of SNe 1999br and 2005cs, assuming negligible host reddening (Fig. 2). Furthermore, the spectral energy distribution of our 52 d spectrum matches these two comparison SNe, without requiring any additional reddening correction (Fig. 3). These similarities, taken together with the absence of narrow Na i D absorption lines point towards little host reddening in SN 2014bc, and in what follows, we treat it as negligible, and correct only for Galactic reddening. At first glance, this may be in stark contradiction to expectations, given the location of the SN. However, in the case of SN 2014bc, it is likely that its small galactocentric distance is merely a projection in front of the nucleus, rather than an indication that it is embedded in the galaxy core; other examples include SNe 2010cu and 2011hi, both of which occurred at projected distances of ≲400 pc from the centre of the dusty, luminous infrared galaxy IC 883 (100 Mpc), but had low inferred host galaxy extinctions (Kankare et al. 2012). Thus, using the maser distance modulus to NGC 4258, we find the absolute average plateau brightness to be Mr = −14.48 mag and Mi = −14.65 mag.
3. SCM applied to SN 2014bc
A tight, positive correlation between the (quasi-) bolometric luminosity and expansion velocity during the plateau phase of type IIP SNe allows them to be used as standardised candles (Hamuy & Pinto 2002). The mid-point of the plateau (~50 d) is traditionally used as a convenient reference point.
In order to apply this method to SN 2014bc, we first converted the gri magnitudes of SN 2014bc to VRI using the transformations of Jester et al. (2005), and fit low order polynomials to the resulting light curves to estimate the magnitudes at 50 d. The resulting magnitudes are mV = +15.32 ± 0.10 mag and mI = +14.60 ± 0.12 mag (uncorrected for reddening). As a check, we computed synthetic mV and mI magnitudes from the 52 d spectrum using the sms code (Synthetic Magnitudes from Spectra) within the S3 package (Inserra et al., in prep.), which we found to be consistent within the uncertainties of the above transformations. The expansion velocities of type II SNe are generally measured using weak lines as these are better tracers of the photospheric velocity, with the Fe ii λ5169 line typically being used. However, in SN 2014bc, this line does not form a clean P-Cygni profile, and appears to suffer from blending (see inset in Fig. 3). We therefore used the weighted mean of the Fe iiλ4629, λ4924, λ5018, and λ5276 lines instead. We normalised the spectrum by fitting a low order polynomial to the pseudo-continuum and subtracting it from the spectrum. The velocity of each line was then estimated by measuring the position of the minimum of the absorption component with respect to the rest wavelength, by fitting Gaussian profiles. The procedure was repeated several times across slightly different wavelength ranges. Each line was then weighted by the standard deviation, yielding a velocity of vFe ii = 1460 ± 100 km s-1.
Next, we applied a series of SCM calibrations derived from different samples of type IIP SNe. Each calibration is based on relations between the expansion velocity at 50 d post-explosion, the coeval I-band magnitude (mI), and a reddening term. The resulting distances for SN 2014bc from the calibrations are given in Table 1. The differences between the SCM and maser distance moduli are provided, along with the median distance of the sample of SNe used in each calibration. These Δμ values are related to the corrections to the zero points required to bring the calibrations into agreement agreement with the maser distance. Although there is a spread in the values, all calibrations are reassuringly consistent with that inferred from at least one of the primary distance indicators. In particular, only the Nugent et al. (2006) calibration which excludes high-redshift SNe, marked “2b” in Table 1, is not consistent with the maser distance.
In order to further investigate the scatter among the various calibrations, we applied the SCM to all type IIP SNe that occurred in galaxies for which Cepheid distances have been measured, and for which a spectrum taken approximately at the mid-plateau point was available (Table A.2). The differences between the SCM and Cepheid distance moduli are listed in Table A.3. We find that the Hamuy (2003b) and Nugent et al. (2006) calibrations provide distance estimates that are closest to the Cepheid distances; however, most of the differences across all calibrations are within the typical uncertainty of ~0.3 mag. All SCM calibrations yield a distance estimate to SN 2004dj – the nearest SN in our sample – that is longer than the corresponding Cepheid distance to the host galaxy. We speculate that this may be related to the late discovery of SN 2004dj, coupled with the uncertainty in its explosion epoch (Zhang et al. 2006). A Hubble diagram of these objects, using the Cepheid measurements and Riess et al. (2011) H0 value to fix the distance scale (Fig. 4), shows a remarkably small scatter (σI ~ 0.16 mag) after applying the following SCM correction:  (1)This calibration provides a distance estimate to SN 2014bc of 7.08 ± 0.86 Mpc, in agreement with the maser distance.
Distance estimates to NGC 4258.
4. Conclusions
Based on measurements of SN 2014bc, we find the SCM distance to the anchor galaxy NGC 4258 to be encouragingly consistent with the geometric maser distance, even though there is considerable scatter amongst the various calibrations. The current number of type IIP SNe occurring in galaxies with a previously measured Cepheid distance is surprisingly small. However, as for the SNe Ia, we expect the type IIP SN systematics to be better quantified in the coming years. Natural and immediate next steps, but ones that go beyond the scope of this work, would be to readjust the Cepheid-based distances to the galaxies listed in Table A.2 using self-consistent P − L calibrations and the revised LMC Cepheid distance modulus (Fausnaugh et al. 2015). Our expectation would be one of a knock-on further reduction in scatter for the various SCM calibrations when anchored to a sample akin to the one we present in Table A.3 and Fig. 4.
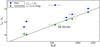 |
Fig. 4 Hubble diagram of SNe listed in Table A.2, using the Cepheid distances and H0 = 73.8 km s-1 Mpc-1. The blue circles are corrected for reddening only, while the green stars are corrected for expansion velocities via least-squares fitting. |
Online material
Appendix A: Tables
Photometry of SN 2014bc.
Details of recent type IIP SNe in host galaxies with Cepheid distance measurements.
Shift in zero points of the 4 SCM calibrations as a result of fixing the SN distance to the respective Cepheid distance to the host galaxy.
Acknowledgments
We thank B. Leibundgut for useful comments on an earlier draft. R.K. acknowledges support from STFC via ST/L000709/1. S.J.S. acknowledges funding from the ERC via Grant agreement No. [291222]. Support by the Deutsche Forschungsgemeinschaft via the Transregional Collaborative Research Center TRR 33 “The Dark Universe” is acknowledged. Based in part on observations carried out with the Gran Telescopio Canarias (GTC2007-12ESO), and the Liverpool Telescope installed in the Spanish Observatorio del Roque de los Muchachos of the Instituto de Astrofísica de Canarias, on the island of La Palma. The LT is operated by Liverpool John Moores University with financial support from STFC. Based in part on observations made with ESO Telescopes at the La Silla Paranal Observatory under programme ID 081.D-0128. PS1 is supported by NASA Grants NNX12AR65G and NNX14AM74G from NEO Observation Program. This paper includes observations obtained with MegaPrime/MegaCam, a joint project of CFHT and CEA/DAPNIA, at the Canada-France-Hawaii Telescope (CFHT), which is operated by the National Research Council (NRC) of Canada, the Institut National des Science de l’Univers of the Centre National de la Recherche Scientifique (CNRS) of France, and the University of Hawaii.
References
- Cano, Z., & Jakobsson, P. 2014, ApJ, submitted [arXiv:1409.3570] [Google Scholar]
- Dall’Ora, M., Botticella, M. T., Pumo, M. L., et al. 2014, ApJ, 787, 139 [NASA ADS] [CrossRef] [Google Scholar]
- D’Andrea, C. B., Sako, M., Dilday, B., et al. 2010, ApJ, 708, 661 [NASA ADS] [CrossRef] [Google Scholar]
- Eastman, R., Schmidt, B. P., & Kirshner, R. 1996, ApJ, 466, 911 [NASA ADS] [CrossRef] [Google Scholar]
- Elmhamdi, A., Danziger, I. J., Chugai, N., et al. 2003, MNRAS, 338, 939 [NASA ADS] [CrossRef] [Google Scholar]
- Fausnaugh, M., Kochanek, C. S., Gerke, J. R., et al. 2015, MNRAS, 450, 3597 [NASA ADS] [CrossRef] [Google Scholar]
- Fiorentino, G., Musella, I., & Marconi, M. 2013, MNRAS, 434, 2866 [NASA ADS] [CrossRef] [Google Scholar]
- Freedman, W. L., Madore, B. F., Gibson, B. K., et al. 2001, ApJ, 553, 47 [NASA ADS] [CrossRef] [Google Scholar]
- Hamuy, M. 2003a, ApJ, 582, 905 [NASA ADS] [CrossRef] [Google Scholar]
- Hamuy, M. 2003b, Proc. IAU Colloq., 192 [arXiv:astro-ph/0309122] [Google Scholar]
- Hamuy, M., & Pinto, P. A. 2002, ApJ, 566, L63 [NASA ADS] [CrossRef] [Google Scholar]
- Humphreys, E. M. L., Reid, M. J., Moran, J. M., et al. 2013, ApJ, 775, 13 [Google Scholar]
- Inserra, C., & Smartt, S. 2014, ApJ, 796, 87 [NASA ADS] [CrossRef] [Google Scholar]
- Jester, S., Schneider, D. P., Richards, G. T., et al. 2005, AJ, 130, 873 [NASA ADS] [CrossRef] [Google Scholar]
- Kaiser, N., Burgett, W., Chambers, K., et al. 2010, SPIE, 7733 [Google Scholar]
- Kankare, E., Mattila, S., Ryder, S., et al. 2012, ApJ, 744, L19 [NASA ADS] [CrossRef] [Google Scholar]
- Leonard, D. C., Kanbur, S. M., Ngeow, C. C., et al. 2003, ApJ, 594, 247 [NASA ADS] [CrossRef] [Google Scholar]
- Li, X., Hjorth, J., & Wojtak, R. 2014, ApJ, 796, L4 [NASA ADS] [CrossRef] [Google Scholar]
- Macri, L., Stanek, K. Z., Bersier, D., et al. 2006, ApJ, 652, 1133 [NASA ADS] [CrossRef] [Google Scholar]
- Magnier, E. A., Schlafly, E., Finkbeiner, D., et al. 2013, ApJS, 205, 20 [NASA ADS] [CrossRef] [Google Scholar]
- Meikle, W. P. S., Kotak, R., Farrah, D., et al. 2011, ApJ, 732, 109 [NASA ADS] [CrossRef] [Google Scholar]
- Nugent, P., Sullivan, M., Ellis, R., et al. 2006, ApJ, 645, 841 [NASA ADS] [CrossRef] [Google Scholar]
- Ochner, P., Tomasella, L., Benetti, S., et al. 2014, ATel, 6160 [Google Scholar]
- Pastorello, A., Zampieri, L., Turatto, M., et al. 2004, MNRAS, 347, 74 [NASA ADS] [CrossRef] [Google Scholar]
- Pastorello, A., Valenti, S., Zampieri, L., et al. 2009, MNRAS, 394, 2266 [NASA ADS] [CrossRef] [Google Scholar]
- Pietrzyński, G., Gieren, W., Hamuy, M., et al. 2010, AJ, 140, 1475 [NASA ADS] [CrossRef] [Google Scholar]
- Pignata, G. 2013, in Massive Stars: From alpha to Omega, 176 [Google Scholar]
- Poznanski, D., Butler, N., Filippenko, A. V., et al. 2009, ApJ, 694, 1067 [NASA ADS] [CrossRef] [Google Scholar]
- Riess, A. G., Macri, L., Casertano, S., et al. 2011, ApJ, 730, 119 [NASA ADS] [CrossRef] [Google Scholar]
- Schlafly, E. F., & Finkbeiner, D. P. 2011, ApJ, 737, 103 [NASA ADS] [CrossRef] [Google Scholar]
- Schlafly, E. F., Finkbeiner, D. P., Jurić, M., et al. 2012, ApJ, 756, 158 [NASA ADS] [CrossRef] [Google Scholar]
- Smartt, S. J., Maund, J. R., Gilmore, G. F., et al. 2003, MNRAS, 343, 735 [NASA ADS] [CrossRef] [Google Scholar]
- Smartt, S. J., Smith, K. W., Wright, D., et al. 2014, ATel, 6156 [Google Scholar]
- Tonry, J. L., Stubbs, C. W., Kilic, M., et al. 2012a, ApJ, 745, 42 [NASA ADS] [CrossRef] [Google Scholar]
- Tonry, J. L., Stubbs, C. W., Lykke, K. R., et al. 2012b, ApJ, 750, 99 [NASA ADS] [CrossRef] [Google Scholar]
- Turatto, M., Benetti, S., & Cappellaro, E. 2003, in From Twilight to Highlight: The Physics of SNe (Springer-Verlag), 200 [Google Scholar]
- Van Dyk, S. D., Li, W., & Filippenko, A. V. 2003, PASP, 115, 448 [NASA ADS] [CrossRef] [Google Scholar]
- Vinkó, J., Takáts, K., Sárneczky, K., et al. 2006, MNRAS, 369, 1780 [NASA ADS] [CrossRef] [Google Scholar]
- Yaron, O., & Gal-Yam, A. 2012, PASP, 124, 668 [NASA ADS] [CrossRef] [Google Scholar]
- Zhang, T., Wang, X., Li, W., et al. 2006, AJ, 131, 2245 [NASA ADS] [CrossRef] [Google Scholar]
- Zheng, W., & Filippenko, A. V. 2014, ATel, 6159 [Google Scholar]
All Tables
Details of recent type IIP SNe in host galaxies with Cepheid distance measurements.
Shift in zero points of the 4 SCM calibrations as a result of fixing the SN distance to the respective Cepheid distance to the host galaxy.
All Figures
|
Fig. 1 Top: r′-band image of SN 2014bc
(left), pre-explosion image (middle), and the
difference between the two (right). SN 2014bc is located at
αJ2000 =
12:18:57.71, δJ2000 = + 47:18:11.3, projected
|
| In the text | |
|
Fig. 2 Top: light curves of SN 2014bc, corrected for Galactic reddening. The absolute magnitude scale was determined using μ = 29.4 mag. The R-band light curves of the type IIP SNe 1999br and 2005cs are shown according to the absolute magnitude scale. Downward pointing arrows indicate limiting magnitudes. The vertical dashed lines indicate the spectroscopic epochs of SN 2014bc. Small differences between the SDSS and PS1 photometric systems are evident (Tonry et al. 2012b). Middle and bottom: colours of SNe 2014bc compared to SNe 1999br, 2005cs, and 1999em. |
| In the text | |
|
Fig. 3 Optical spectra of SNe 2014bc, 1999br, and 2005cs, all at approximately 50 d after explosion. The spectra have been corrected for reddening and redshift. The ⊕ symbol indicates significant telluric absorption. Insets a) and b) show zoom-ins of the Fe ii λ5169 and Na i D regions respectively. Inset c) shows a zoom-in of the higher resolution 102 d spectrum of SN 2014bc. The rest wavelengths of Fe ii λ5169, Ba ii λ5854 and the Na i λλ5890, 5896 doublet are marked by vertical red lines in the inset panels. |
| In the text | |
|
Fig. 4 Hubble diagram of SNe listed in Table A.2, using the Cepheid distances and H0 = 73.8 km s-1 Mpc-1. The blue circles are corrected for reddening only, while the green stars are corrected for expansion velocities via least-squares fitting. |
| In the text | |
Current usage metrics show cumulative count of Article Views (full-text article views including HTML views, PDF and ePub downloads, according to the available data) and Abstracts Views on Vision4Press platform.
Data correspond to usage on the plateform after 2015. The current usage metrics is available 48-96 hours after online publication and is updated daily on week days.
Initial download of the metrics may take a while.