Fig. 2
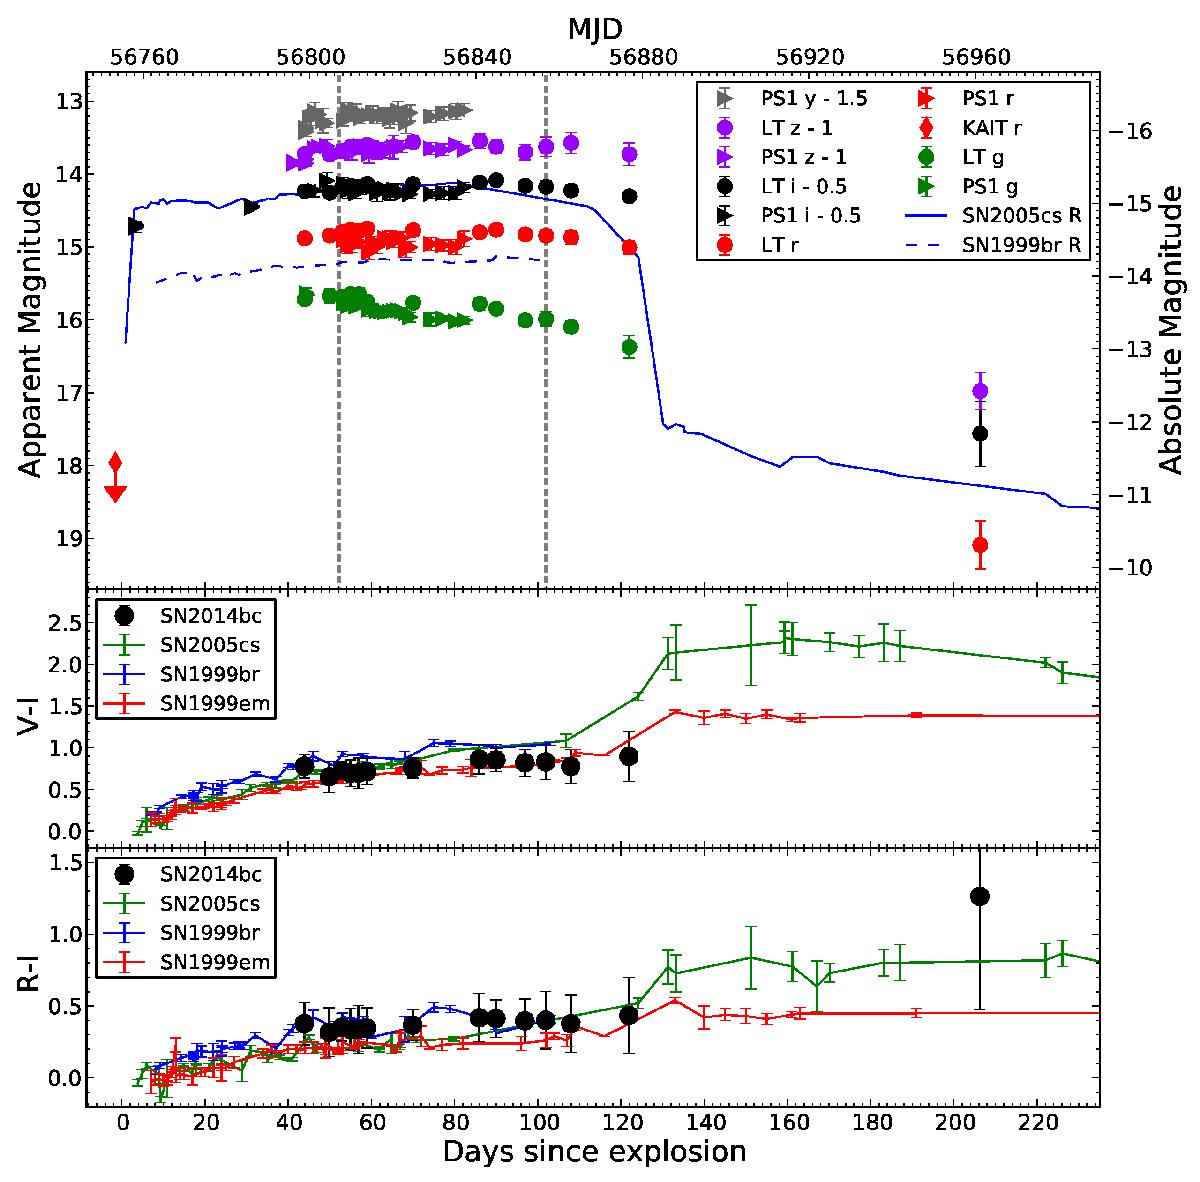
Top: light curves of SN 2014bc, corrected for Galactic reddening. The absolute magnitude scale was determined using μ = 29.4 mag. The R-band light curves of the type IIP SNe 1999br and 2005cs are shown according to the absolute magnitude scale. Downward pointing arrows indicate limiting magnitudes. The vertical dashed lines indicate the spectroscopic epochs of SN 2014bc. Small differences between the SDSS and PS1 photometric systems are evident (Tonry et al. 2012b). Middle and bottom: colours of SNe 2014bc compared to SNe 1999br, 2005cs, and 1999em.
Current usage metrics show cumulative count of Article Views (full-text article views including HTML views, PDF and ePub downloads, according to the available data) and Abstracts Views on Vision4Press platform.
Data correspond to usage on the plateform after 2015. The current usage metrics is available 48-96 hours after online publication and is updated daily on week days.
Initial download of the metrics may take a while.