Fig. 3
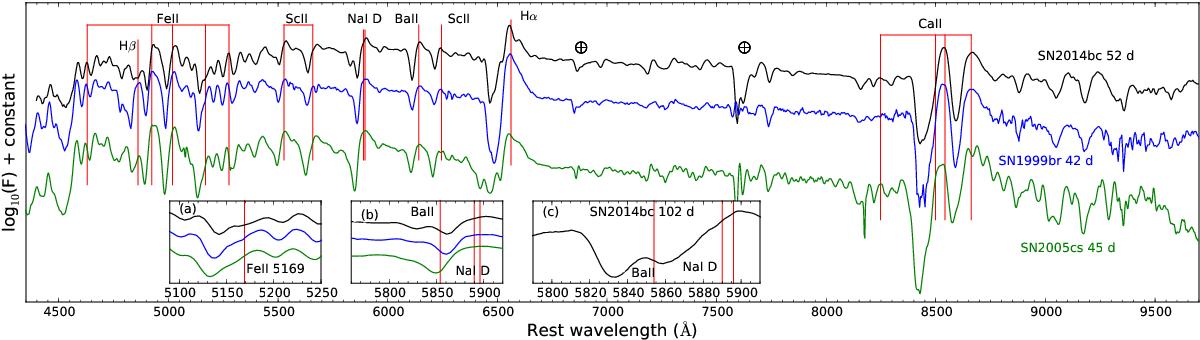
Optical spectra of SNe 2014bc, 1999br, and 2005cs, all at approximately 50 d after explosion. The spectra have been corrected for reddening and redshift. The ⊕ symbol indicates significant telluric absorption. Insets a) and b) show zoom-ins of the Fe ii λ5169 and Na i D regions respectively. Inset c) shows a zoom-in of the higher resolution 102 d spectrum of SN 2014bc. The rest wavelengths of Fe ii λ5169, Ba ii λ5854 and the Na i λλ5890, 5896 doublet are marked by vertical red lines in the inset panels.
Current usage metrics show cumulative count of Article Views (full-text article views including HTML views, PDF and ePub downloads, according to the available data) and Abstracts Views on Vision4Press platform.
Data correspond to usage on the plateform after 2015. The current usage metrics is available 48-96 hours after online publication and is updated daily on week days.
Initial download of the metrics may take a while.