| Issue |
A&A
Volume 539, March 2012
|
|
|---|---|---|
| Article Number | A98 | |
| Number of page(s) | 13 | |
| Section | Planets and planetary systems | |
| DOI | https://doi.org/10.1051/0004-6361/201118075 | |
| Published online | 29 February 2012 | |
Eccentricity of radiative disks in close binary-star systems
1 Dipartimento di Fisica, University of Padova, via Marzolo 8, 35131 Padova, Italy
e-mail: francesco.marzari@pd.infn.it
2 DAMTP, University of Cambridge, Wilberforce Road, Cambridge CB30 WA, UK
3 Department of Astronomy and Astrophysics, University of California, Santa Cruz, CA 95064, USA
4 Laboratoire Cassiopée, Université de Nice Sophia Antipolis, CNRS, Observatoire de la Côte d’Azur, BP 4229, 06304 Nice Cedex, France
5 Observatoire de Paris, Section de Meudon, 92195 Meudon Principal Cedex, France
Received: 12 September 2011
Accepted: 10 January 2012
Context. Disks in binaries have a complex behavior because of the perturbations of the companion star. Planetesimal growth and planet formation in binary-star systems both depend on the companion star parameters and the properties of the circumstellar disk. An eccentric disk may significantly increase the impact velocity of planetesimals and therefore jeopardize the accumulation process.
Aims. We model the evolution of disks in close binaries including the effects of self-gravity and adopting different prescriptions to model the disk radiative properties. We focus on the dynamical properties and evolutionary tracks of the disks.
Methods. We use the hydrodynamical code FARGO and include in its energy equation both heating and cooling effects.
Results. Radiative disks have a lower disk eccentricity than locally isothermal disks with the same temperature profile. Their average eccentricity is about 0.05, and is almost independent of the eccentricity of the binary orbit, in contrast to locally isothermal disk models. As a consequence, we do not observe the formation of an internal elliptical low density region as in locally isothermal disk models. However, the disk eccentricity depends on the disk mass in terms of the opacities. Akin to locally isothermal disk models, self-gravity forces the disk’s longitude of pericenter to librate about a fixed orientation with respect to the binary apsidal line (π).
Conclusions. The disk radiative properties play an important role in the evolution of disks in binaries. A radiative disk has an overall shape and internal structure that differ significantly from those of a locally isothermal disk with a similar temperature profile. This is an important finding for both describing the evolutionary track of the disk during its progressive mass loss, and for planet formation because the internal structure of the disk is relevant to planetesimal growth in binary systems. The non-symmetrical distribution of mass in these disks causes high eccentricities for planetesimals, whose growth may be affected.
Key words: protoplanetary disks / methods: numerical / planets and satellites: formation
© ESO, 2012
1. Introduction
Protoplanetary disks are known to exist in pre-main-sequence binary star systems through direct imaging (Koerner et al. 1993; Stapelfeldt et al. 1998; Rodríguez et al. 1998) and spectral energy distributions (Ghez et al. 1993; Prato et al. 2003; Monin et al. 2007). Petr-Gotzens et al. (2010) claimed that as many as 80% of all binary star systems in the ~1 Myr old Orion Nebula Cluster might have an active accretion disk. Trilling et al. (2007) showed that the incidence of debris disks in binary systems is not that different from that of single stars. These observations seem to suggest that the conditions are amenable to planet formation in binary star systems even if, at subsequent stages, the gravitational perturbations by the companion star may have a negative impact on the growth process. Bonavita & Desidera (2007) and Mugrauer & Neuhäuser (2009) demonstrated that the frequency of planets in binaries does not differ much from that of planets orbiting single stars. However, this frequency depends critically on the binary separation and close binaries appear to be less favorable environments for planet formation. Only a few planets are presently known to exist in tight systems (GI86, HD41004, and γ Cephei) and it is expected that when the binary separation is in the range 20–100 AU the gravitational influence of the companion star must have influenced the planet formation process, affecting either the disk evolution or the planetesimal accumulation process (Desidera & Barbieri 2007).
Of particular importance are the initial stages of planetesimal evolution when the mutual impact velocities must remain low to allow mass growth despite the perturbations by the companion star. Previous studies (e.g., Marzari & Scholl 2000; Thébault et al. 2006, 2008, 2009; Paardekooper et al. 2008; Xie & Zhou 2009; Paardekooper & Leinhardt 2010) have shown that the combination of gas drag force and secular perturbations by the secondary star has strong effects on planetesimal orbits, leading to pericenter alignment and to an equilibrium distribution for the eccentricity of small planetesimals. Since the magnitude of the gas drag force depends on the planetesimal size, the variation in both the eccentricity and pericenter longitude with particle size may well inhibit the formation of larger bodies by exciting large mutual impact velocities.
One question that needs to be addressed is the extent to which the disk perturbation due to the companion star (e.g., Lubow 1991a,b; Kley et al. 2008) affects the distributions of eccentricity and longitude of pericenter for planetesimals of different size. Models in which the planetesimal orbital evolution was computed along with the time evolution of the disk (Kley & Nelson 2008; Paardekooper et al. 2008) showed that the disk eccentricity may strongly influence the dynamics of small planetesimals by introducing radial gas drag forces and non-axisymmetric components into the gravity field of the disk. This additional perturbing force may act either in favor or against planetesimal accretion depending on the relative impact velocities between the bodies. An in-depth analysis is needed to explore the strength of these perturbations. This first requires an investigation of the impact of the companion star on the disk’s eccentricity. We focus on relatively close binary-star systems with large mass ratios and potentially high eccentricities that, according to Duquennoy & Mayor (1991), populate the peak of the frequency distribution in our neighborhood. Modeling the response of a protoplanetary disk to the gravitational perturbations by a secondary (companion) star requires by necessity a numerical approach, since it is difficult to predict analytically the disk shape and evolution with time.
In a previous paper (Marzari et al. 2009, hereafter Paper I), we used the numerical code FARGO to model the time evolution of a two-dimensional (2D) circumstellar disk in close binary star systems, including the effects of disk self-gravity. We focused on massive disks, with an initial mass equal to 0.04 M⊙, as well as a large binary mass ratio (μ = Ms/Mp = 0.4). This value is statistically the most frequent among the binary systems observed so far (Duquennoy & Mayor 1991). We found that self-gravity significantly affects the increase in the disk eccentricity induced by the companion perturbations, and also influences the orientation of the disk relative to the binary reference frame by causing libration instead of circulation. We also sampled different values of the binary’s eccentricity, eb, ranging from 0 to 0.6. The main findings of Paper I were the following:
-
self-gravity plays a significant role in shaping the disk. The dynamical eccentricity ed (defined in Sect. 2.3) of the disk typically ranges from ~0.05 to ~0.15, depending on the binary eccentricity, eb. It is smaller than in models without self gravity;
-
the eccentricity ed is inversely proportional to eb, with the case of a circular binary (eb = 0) being the most perturbing configuration;
-
the disk orientation ωd (defined in Sect. 2.3) librates around π, as it circulates in the absence of self-gravity;
-
an eccentric low-density region develops in the inner disk parts because of the high eccentricity and aligned pericenters of the gas streamlines there.
The results of Paper I were obtained by assuming a locally isothermal equation of state for the gas, wherein the initial radial profile of the temperature remains constant in time, its value being set by the choice for the disk aspect ratio h = H/r, where H is the pressure scale height. This approximation is well-suited to disk regions where radiation cooling is efficient and the gas is optically thin. However, in the initial stages of their evolution in particular, disks may be optically thick and a more detailed treatment of the energy balance is required. In addition, when it passes at its pericenter, the secondary star triggers spiral shocks that may generate local strong shocks and compressional heating, which may violate the local isothermal approximation. The propagation of these shock waves may also be altered significantly in radiative disks. In this paper, we focus on how the disk eccentricity and orientation depend on the disk radiative properties. Our approach is the following. We first examine how our previous results for locally isothermal disks depend on the choice of (fixed) temperature profile of the disk. We then consider disk models with a radiative energy equation, for which we find that the average disk eccentricity in its inner parts is lower than for locally isothermal disk models with similar temperature profiles. We finally discuss the impact of our results in terms of planetesimal dynamics.
2. Model description
2.1. Code
Two-dimensional hydrodynamical simulations were carried out with the ADSG version1 of the code FARGO. The code solves the hydrodynamical equations on a polar grid, and uses an upwind transport scheme along with a harmonic, second-order slope limiter (van Leer 1977). The ADSG version of the FARGO code includes an adiabatic energy equation and a self-gravity module based on fast Fourier transforms (Baruteau & Masset 2008). Heating and cooling source terms have been implemented in the energy equation as described in Sect. 2.2. The specificity of the FARGO algorithm is to use a change of rotating frame on each ring of the grid, which increases the timestep significantly.
The results of simulations are expressed in the following code units: the mass unit is the mass of the primary star, Mp, which is assumed to be equal to 1 M⊙. The length unit is set to 1 AU, and the orbital period at 1 AU is 2π times the code’s time unit.
2.2. Physical model and numerical setup
We adopt a 2D disk model in which self-gravity and an energy equation are included (unless otherwise stated). The hydrodynamical equations are solved in a cylindrical coordinate system {r,ϕ } centered on the primary star, with r ∈ [0.5−15 AU] and ϕ ∈ [ 0,2π] . The grid used in our calculations has Nr = 256 radial zones and Ns = 512 azimuthal zones, and a logarithmic spacing is used along the radial direction. The frame rotates with the Keplerian angular velocity at the binary’s semi-major axis, and we include the indirect terms accounting for the acceleration of the primary caused by the gravity of both the secondary and the disk.
Binary parameters – Throughout this study, we have adopted as a standard model a binary system where the secondary star has a mass Ms = 0.4 M⊙. The binary is held on a fixed eccentric orbit with semi-major axis ab = 30 AU and eccentricity eb = 0.4, corresponding to an orbital period ≈ 134 yr.
Energy equation – Since the purpose of this work is to examine the impact of an energy equation on the disk response to the periodic passages of a close companion, we have carried out simulations including either an energy equation, or a locally isothermal equation such that the initial temperature profile remains constant in time. In all cases, the disk verifies the ideal gas law  (1)where p and T denote the vertically-integrated pressure and temperature, respectively, Σ is the mass surface density, ℛ is the ideal gas constant, and μ is mean molecular weight, which is taken equal to 2.35. When included, the energy equation takes the form
  (2)where e = p/(γ − 1) is the thermal energy density, γ is the adiabatic index, and v denotes the gas velocity. We assume that γ = 1.4 throughout this study. In Eq. (2),
  denotes the viscous heating. We use both a constant shear kinematic viscosity, ν = 10-5 in code units, and a von Neumann-Richtmyer artificial bulk viscosity, as described in Stone & Norman (1992), where the coefficient C2 is taken to be equal to 1.4 (where C2 measures the number of zones over which the artificial viscosity spreads out shocks). The cooling source term in Eq. (2),
  , is assumed to be
  , where σSB is the Stefan-Boltzmann constant, and Teff is the effective temperature (Hubeny 1990)
  (3)for an effective optical depth
  (4)The vertical optical depth, τ, is approximated as τ = κΣ/2, where for the Rosseland mean opacity, κ, the formulae in Bell & Lin (1994) are adopted. Following Paardekooper et al. (2011), we also model thermal diffusion as the diffusion of the gas entropy, s, defined as s = ℛ(γ − 1)-1log (p/Σγ). This corresponds to the last term in the right-hand side of Eq. (2), where λ is a constant thermal diffusion coefficient. Throughout this study, we adopt λ = 10-6 in code units.
Initial conditions – The disk is initially axisymmetric and the angular frequency Ω(r) about the primary star is computed by taking into account the radial acceleration due to the pressure gradient, the gravitational acceleration due to the primary star only, and the self-gravity of the disk. The initial gas surface density, Σ0, is set to Σ0(r) = Σ0(1 AU) × (r/1 AU) − 1/2 where Σ0(1 AU) = 2.5 × 10⁻⁴ in code units. Assuming that the mass of the primary star is 1 M⊙, this corresponds to setting the disk surface density at 1 AU to ≈ 2.2 × 10³ g cm-2. Beyond 11 AU, Σ0(r) is smoothly reduced to a floor value, Σfloor = 10-9 = 4 × 10⁻⁶ Σ0(1 AU), using a Gaussian function with a standard deviation equal to 0.4 AU. To prevent numerical instabilities caused by low density values or by steep density gradients near the grid’s outer edge, the gas density in each grid cell is reset to Σfloor whenever it becomes lower than this floor value (Kley et al. 2008, Paper I). In a similar way, we adopt a floor value for the thermal energy density of efloor = 10-18. Our choice of this parameter has been conservative, and we checked that with a larger ivalue of efloor, the modeled disk behaved similarly. The initial gas temperature, T0, is taken proportional to r-1 namely T0 = T0(1 AU) × (r/1 AU)-1, where the value for T0(1 AU), which is taken as a free parameter in our study, is specified below. Writing the pressure scale height H as  , where cS denotes the sound speed and ΩK the Keplerian angular frequency, the disk temperature can be conveniently related to the disk’s aspect ratio, h = H/r. In our code units, where ℛ/μ = 1, this yields T0(1 AU) = 630 K × { h(1 AU)/0.05 } 2.
Boundary conditions – By default, an outflow zero-gradient boundary condition is adopted at both the grid’s inner and outer edges. The azimuthal velocity is set to its initial, axisymmetric value. No mass therefore flows back into the system, and the disk mass declines with time. The impact of the inner boundary condition on our results is examined in Sect. 4.3.
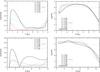 |
Fig. 1 Azimuthally and time-averaged profiles of the disk’s eccentricity (left column) and surface density (Σ, right column) obtained with the series of locally isothermal disk models described in Sect. 3. In the density profile plot we include the initial, unperturbed profile, which is shown as reference. Results are shown at 60 orbits of the secondary, and time-averaging is done over 5 orbits. Several values of the disk’s aspect ratio at 1 AU are considered and two secondary-to-primary mass ratios of q = 0.4 (upper panels) and q = 0.1 (lower panels). |
2.3. Notations
We make use of the following quantities. We denote with ed and ϖd the disk eccentricity and perihelion longitude, respectively. They are defined as in Kley et al. (2008), Pierens & Nelson (2007) and Marzari et al. (2009) to be  (5)and
  (6)where Md denotes the disk mass, and e and ϖ are the eccentricity and pericenter longitude of each grid cell, respectively, assuming that the local position and velocity vectors uniquely define a two-body Keplerian orbit.
3. Locally isothermal disk models
Before examining the impact of an energy equation on the disk’s response to the tidal perturbations by the secondary star, we adopt in this section the simpler case of a locally isothermal equation of state, where the initial (axisymmetric) profile of the disk temperature remains fixed. This first step helps us analyze the more complex situation of a disk whose temperature evolves in time due to radiative cooling and various sources of heating, including that arising from the shock waves induced by the secondary.
3.1. Disk’s eccentricity and surface density profiles
We carried out a series of simulations using a range of values for the disk aspect ratio at 1 AU, h(1 AU), which is equivalent to varying the disk’s temperature at the same location. Other disk and binary parameters are as described in Sect. 2.2. We consider two different values of the secondary-to-primary mass ratio: q = 0.4 (our fiducial value) and q = 0.1. Results of simulations with q = 0.4 are shown in the upper panels of Fig. 1, and those with q = 0.1 in the lower panels. Azimuthally and time-averaged profiles of the disk’s eccentricity and surface density are displayed in the left and right columns of Fig. 1, respectively. Profiles are displayed after ~60 orbits of the secondary, and time averaging is done over 5 orbits. By checking the time evolution of the disk’s eccentricity profile, we find that a steady state is reached after typically 20 binary revolutions with q = 0.4 for all values of h, and after 40 revolutions for q = 0.1. The value of h(1 AU) is indicated in each panel (and simply denoted by h).
We are primarily interested in the disk average eccentricity in its inner parts, below the truncation radius located at r ~ 5−6 AU for q = 0.4, where planet formation is more likely to occur. As shown in Marzari et al. (2009), the truncation radius of the disk closely matches the critical limit for orbital stability caused by the secular perturbations of the companion star (Holman & Wiegert 1999). From Fig. 1, it is clear that the disk eccentricity increases from r ~ 4 AU downwards, peaks at r ≲ 1 AU, then decreases towards the location of the grid’s inner edge, where the boundary condition imposes zero eccentricity. Interestingly, we see that the averaged peak eccentricity of the disk (reached at r ≲ 1 AU) increases with h up to h = 0.05 and decreases beyond this value. The same behavior is found for both values of q, and may be interpreted as follows. The disk’s density perturbation due to the secondary decreases with increasing disk aspect ratio (h or, equivalently, increasing sound speed). In the limit of large aspect ratios, the disk’s eccentricity thus decreases with increasing h. As h decreases, the disk’s perturbed density increases, but shock waves become more tightly wound, and have to travel a longer distance before reaching the disk’s inner parts. Being then more prone to viscous damping, shock waves become less and less efficient at depositing angular momentum in the disk’s inner parts, where the eccentricity remains small. This explains why when decreasing h, the averaged eccentricity of the disk’s inner parts first reaches a maximum and then decreases.
We can see in Fig. 1 that the radial dependence of the density and eccentricity profiles reasonably match each other, as expected. The general trend is that the higher disk eccentricity profile, the smaller the surface density profile. We note that this is more visible for q = 0.4, where the density perturbation by the secondary takes larger values than for q = 0.1. The significant decrease in the disk’s density profile in the disk inner parts (typically below ~2 AU) takes the form of an elliptic inner hole, which has been observed in a number of previous numerical studies (e.g., Kley et al. 2008, Paper I).
Our results concerning the dependence of the disk’s eccentricity and density profiles with h differ from those of Kley et al. (2008), but this depends on the intrinsic differences in the models. In particular, we consider more massive disks and include the effects of self-gravity, which can significantly affect the disk evolution.
3.2. Fourier analysis of the density distribution
To provide some insight into the dependence of the disk’s eccentricity and density profiles with varying temperature, we examine in this paragraph the Fourier components of the disk’s surface density. Figure 3 displays the instantaneous amplitude of the Fourier mode coefficients for azimuthal wavenumbers of 1 ≤ m ≤ 5. Results are shown at 2550 yr, that is after ≈20 orbits of the secondary, when the disk is truncated at about 7–8 AU. We compare the profiles obtained for a previous series of locally isothermal disk models for q = 0.4, with h = 0.02 (left panel) and h = 0.06 (right panel). The secondary star is half-way between the pericenter and apocenter at this particular point in time.
From Fig. 3, it is clear that the amplitude of Fourier mode coefficients decreases with increasing m, and that the m = 1 mode prevails. The run with h = 0.06 displays larger mode amplitudes throughout the disk’s inner parts, which accounts for the higher disk eccentricity obtained in this case. in additiona, the large amplitude of the m = 1 mode below r ≈ 1 for h = 0.06 is directly associated with an elliptic inner hole, whose presence is clearly evident in the upper panels of Fig. 1.
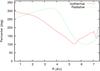 |
Fig. 2 Azimuthally averaged profile of the disk’s pericenter in the locally isothermal disk model with h = 0.05 and q = 0.4 and in the radiative case. It is computed after 100 orbits of the secondary star. |
4. Radiative disk models
We describe the results of our hydrodynamical simulations that include an energy equation. Our aim is to assess the impact of the energy equation on the disk’s average eccentricity.
4.1. Disk eccentricity
As a first step, we compare a radiative and a locally isothermal model with same initial aspect ratio, h = 0.05. All other disk parameters are as described in Sect. 2. Figure 4 shows contours of the disk’s surface density at 90 binary orbits obtained with two values of the binary’s eccentricity: eb = 0.4 (upper panels) and eb = 0 (lower panels). As already pointed out in Sect. 3, eccentric streamlines (m = 1 density mode) have different values of the pericenter depending on the radial distance, and, as a consequence, they combine into a pattern of spiral structure. However, the disks computed with the radiative model (left-handed plots in Fig. 4) appear smoother and more symmetric than the corresponding locally isothermal disks, and, in particular, they do not contain any elliptic hole near the inner edge, independently of eb. The spiral density waves are weaker in the radiative case, possibly because of the absence of a low density region close to the star. The disk eccentricity ed and perihelion longitude are shown as a function of time in Fig. 5 and they confirm that the radiative case has, on average, a lower eccentricity even if it takes more time to reach a steady state. The perihelion libration, which was also observed for the radiative case, strongly suggests that this behaviour is solely due to the disk self-gravity and that it does not depend on the energy equation. By inspecting the radial pericenter profile, even in the radiative case the azimuthally averaged pericenter of the gas streamlines changes with radial distance (as illustrated in Fig. 2). This variation, in addition to causing spiral waves, leads to an asymmetric distribution of mass and then to an asymmetric disk gravity field. This is critical for planetesimals embedded in the disk since the non-homogeneous disk leads to the creation of non-radial components on the gravity field felt by planetesimals significantly perturbing their orbits. These perturbations are comparable in magnitude to the secular effects of the companion star but are irregular and may then cause larger changes in the planetesimal orbital elements. They are indeed an indirect effect of the companion gravity but for planetesimals they represent an independent source of perturbation.
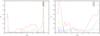 |
Fig. 3 Instantaneous Fourier components of the disk’s surface density for the locally isothermal disk models of Sect. 3 with h = 0.02 (left panel) and h = 0.06 (right panel), respectively. Results are shown at t = 2550 yr (that is, after about 20 orbits of the secondary), and are obtained with q = 0.4. The azimuthal wavenumber for each Fourier component is indicated in the top-right corner of each panel. |
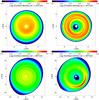 |
Fig. 4 Contours of the gas density after 90 binary revolutions. Results with an energy equation are shown in the left part of this figure, and those with a locally isothermal equation of state with a fixed temperature profile are shown in the right part. The upper plots are for eb = 0.4 and the lower plots for eb = 0.0. The same initial aspect ratio (h = 0.05) is used in these simulations. |
To gain further insight into the different densities and eccentricities with and without an energy equation, we carried out two additional locally isothermal disk models. In the first model, the initial temperature is set to the time-averaged temperature profile of the above radiative run. In the second model, the initial temperature is chosen to give the same sound speed profile as the time-averaged one in the radiative run. In Sect. 3.1, we pointed out that the disk eccentricity in locally isothermal models strongly depends on the aspect ratio h and, as a consequence, on the temperature profile (see Fig. 1). In Fig. 6, bottom plot, we compare the temperature profile of the locally isothermal model with h = 0.05 to the time-averaged temperature profile of the radiative model. The temperature in the radiative run is significantly larger, implying that we should compare the radiative model to a locally isothermal model with h ~ 0.07. In the top panel of Fig. 6, we display the eccentricity and density profiles in all four models: (i) the radiative model, (ii) the locally isothermal model with the same initial aspect ratio as in the radiative model, (iii) the locally isothermal model with the same temperature profile as in the radiative case, and (iv) the locally isothermal model with same sound speed profile as in the radiative one. The disk eccentricity in models (iii) and (iv) is lower than in model (ii), as expected from the results shown in Fig. 1 (top-left panel). Consequently, the disk surface density is higher in models (iii) and (iv) than in model (ii). Nevertheless, models (iii) and (iv) do not match the low eccentricity of the radiative case and its smooth density distribution close to the star. The strength of the m = 1 Fourier mode in the radiative run is smaller in the disk’s inner parts, and this difference depends on the form of the energy equation. In Fig. 7, we display density contours obtained with the radiative run (left panel), and with the locally isothermal model that has the same temperature profile (right panel). In the radiative model, the wave perturbations are less strong and the waves appear to be more damped. Since the waves are weaker in the inner disk parts in the radiative case, the waves should be less efficient at depositing angular momentum there. This would explain why radiative disks are less eccentric in the regions close to the central star, and why the surface density is more homogeneous.
4.2. Radiative damping of waves
The main question arising from previous results is what causes a stronger damping of density waves in the radiative model than in the locally isothermal one, while the same (time-averaged) sound speed profile is adopted in both models. In Fig. 6, the radiative model has indeed a significantly lower eccentricity profile. Assuming that the disk eccentricity is related to the strength of the density waves induced by the binary gravitational perturbations, we have shown in Fig. 7 that spiral waves are more damped in the radiative case.
There are two potential sources of wave damping that may help us to understand why the disk eccentricity remains lower in the radiative case: shock damping (Goodman & Rafikov 2001) and radiative damping (Cassen & Woolum 1996). To explore the efficiency of the shock damping mechanism, we examined the vortensity distribution in the disk, since it experiences a jump at shocks, the magnitude of which depends on the strength of the shock. We did not observe significant differences in the disk vortensity distribution between the two models and thus we believe that shock damping does not contribute significantly to the smoother behaviour of the radiative disk.
The energy loss by radiation is an additional possible source of wave damping (Cassen & Woolum 1996). Wave propagation through adiabatic compressions and expansions may be damped by radiative losses, which, in our model, are controlled by the cooling term  . To test this hypothesis, we restarted our standard radiative simulation (eb = 0.4, Ms = 0.4 M⊙ and ab = 30 AU) after 165 binary revolutions adopting two different cooling prescriptions. In a first run, we limit the cooling time throughout the disk to be no shorter than that at 6 AU from the star (that is, about 150 yr). To keep the temperature profile as close as possible to that of the standard radiative model, and thus to prevent discrepancies related to different temperature profiles, we limit the viscous heating timescale by a similar amount. In a second run, we increase the cooling rate throughout the entire disk by a factor of ten, and the viscous heating rate is increased accordingly. Both restart simulations were run for 50 additional binary orbits, over which the disk’s temperature profile does not evolve significantly, except within 1 AU of the central star.
Figure 8 compares the disk time-averaged eccentricity and temperature profiles of the standard radiative model with those of the additional models with both longer and shorter cooling times. The inner disk’s eccentricity is significantly higher for a longer cooling timescale, exceeding ~0.1 almost uniformly from R = 2 AU to R = 6 AU. This value is in good agreement with that of the locally isothermal run with a similar sound speed profile (see Fig. 6). However, close to the inner edge the disk eccentricity remains small, although this is possibly because we cannot maintain the temperature profile constant within 1 AU of the central star in the model with reduced cooling. In the restart simulation with a cooling rate that is ten times higher, the disk eccentricity is about half that of the standard radiative model, while the corresponding temperature profiles hardly differ.
The results shown in Fig. 8 suggest that radiative damping is responsible for the limited growth in the disk eccentricity compared to similar locally isothermal disk models. This mechanism, like self-gravity, helps to maintain the disk eccentricity at a moderate value.
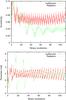 |
Fig. 5 Time evolution of the averaged disk eccentricity ed (upper panel) and pericenter longitude ϖd (lower panel) for the locally isothermal and radiative runs of Sect. 4.1. |
4.3. Dependence on the boundary conditions
We now examine the dependence of our results on the choice of boundary condition at the grid inner edge. For this purpose, we compare the results of simulations using our fiducial boundary condition (zero-gradient outflow boundary condition, see Sect. 4.1) with those of two additional simulations:
-
One that adopts a viscous outflow boundary condition (Kley & Nelson 2008). This is very similar to our zero-gradient outflow boundary condition, except that the radial velocity at the inner boundary is set to the local (azimuthally averaged) viscous inflow velocity of a disk in equilibrium with a locally uniform surface density profile ( − 3ν/2Rmin). The azimuthal velocity is also set to its initial axisymmetric value.
-
Another simulation that also uses our standard outflow boundary condition, but where the azimuthal velocity at the inner boundary is extrapolated from that in the first active ring with a r − 1/2 law. In contrast to previous boundary conditions, the disk at the grid’s inner edge is no longer forced to remain circular.
The results of this comparison for locally isothermal runs with similar temperature profiles as in the radiative model are shown in Fig. 9. The profiles are in good agreement for all three different boundary conditions. We note that the surface density in the inner disk for the viscous boundary condition is higher than that obtained with the two other boundaries. This is expected because the imposed viscous drift velocity is smaller that the radial velocity set by the propagation of the spiral waves induced by the secondary. A similar good agreement is obtained with a radiative model, as illustrated in Fig. 10. These results confirm the insensitivity of our results to the choice of inner boundary condition.
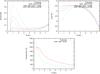 |
Fig. 6 Time- and azimuthally-averaged disk eccentricity, density and temperature profiles for our radiative disk model and various locally isothermal disk models: (i) one with the same initial aspect ratio as in the radiative model (h = 0.05), (ii) one with the same temperature profile as in the radiative model, and (iii) another with same sound speed profile as in the radiative model. |
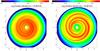 |
Fig. 7 Contours of the disk surface density for the radiative model (left panel), and the locally isothermal model with same imposed temperature profile as in the radiative case (right panel). In the radiative case, spiral waves appear smoother and more damped. |
4.4. Dependence on the binary eccentricity
In Paper I, we demonstrated that the disk eccentricity ed decreases with increasing binary eccentricity, the circular case (eb = 0) being the most perturbing configuration. We interpreted this result as being caused by the larger size of the disk for lower values of eb, and to the consequently larger number of resonant perturbations that may affect it. The eccentricity of radiative disks, however, seems to be rather insensitive to eb. The outcome of the simulations at different eb is shown in the left plot of Fig. 11, where we compare the values of ed obtained for locally isothermal and radiative disks. In contrast to locally isothermal disks, the average ed of radiative disks is almost constant at around 0.05, and it does not show a significant dependence on eb. However, the azimuthally averaged profile of the disk’s eccentricity over the radiative disk does depend on eb. In Fig. 12, the radial profile of the disk’s eccentricity is shown for different values of eb ranging from 0 to 0.6. We note that the eccentricity profiles differ significantly even if the position of the star with respect to the initial reference frame is the same. All radiative runs have higher eccentricity profiles at larges radii, whereas locally isothermal runs feature a peak in the eccentricity in the inner disk parts for most values of h. We note that the above comparison is done by adopting the similar initial aspect ratio for radiative and locally isothermal disk models. A different approach would be to compare disk models with same temperature or sound speed profiles, as done in Figs. 7 and 6. However, when comparing the temperature profiles of the radiative disks, we find that they correspond to locally isothermal disks with h ~ 0.06−0.07, which have a higher eccentricity in the disk inner parts.
In the right panel of Fig. 11, we also compare the values of the outer semi-major axis ad of the ellipse that most closely fit the outer edge of the disk (at a density level of Σ = 10-6, code units). The radiative disks extend slightly farther out than the corresponding locally isothermal disks, except for our fiducial binary’s eccentricity (eb = 0.4), where the disk size is approximately equal to its isothermal counterpart. The mass loss rate for radiative disks, for different values of eb, is shown in Fig. 13. It is computed with a linear fit of the time evolution of the disk mass when a steady state is reached, hence is independent of the initial disk truncation process. It shows an almost linear dependence on eb and is related to the strong perturbation effects on the disk as the secondary star passes at pericenter. The inspection of the amount of mass stripped versus time reveals that almost all the mass loss occurs during and after the pericenter passage of the companion while a smaller amount is constantly lost through the inner border owing to the values of both disk eccentricity and viscosity. The absolute value of the mass loss is large, and a reduction in the disk mass by a factor of two in about 3 × 10⁴ yrs is expected in our standard case (eb = 0.4). However, this value depends on the disk mass, and a simulation with the same binary parameters but an initial disk mass that is ten times smaller gives a mass loss rate ≈ 3.7 × 10⁻⁹ M⊙/yr.
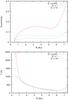 |
Fig. 8 Disk eccentricity and temperature profiles (azimuthally and time-averaged) for our standard radiative model (labeled as Q − × 1), and for two restart simulations with different cooling rates. The disk eccentricity is higher in the restart run with a lower cooling rate (10-3 × Q − ), while it is lower in the restart simulation with a higher cooling rate (10 × Q − ). |
4.5. Dependence on the disk mass
In Paper I, we found that for locally isothermal disks, a decrease in the disk mass had no significant impact on the disk eccentricity. We now show that radiative disks behave differently. In Fig. 14, we compare the disk eccentricity in the nominal case, where the initial density at 1 AU is that of the MMSN, to that of a disk initially 2 and 10 times less massive. The disk eccentricity ed in a steady state is much higher for the less massive disks. This is further illustrated by the contours of the disk density for Σ0 = 0.1ΣMMSN in Fig. 15. The disk appears to be smaller and very eccentric, particularly in its outer regions.
It is difficult to interpret this outcome in terms of the isothermal simulations. Less massive radiative disks, similar to those shown in Fig. 15, have lower temperature profiles. This is presumably due to their higher cooling rates. According to our model, a lower surface density of the disk implies a smaller optical thickness that leads to a shorter cooling timescale. As a consequence, our standard model with Σ0 = 1ΣMMSN has a stationary temperature profile that is equivalent to that of a locally isothermal run with h ~ 7−8% while less massive disks have a lower temperature profile in a steady state, and a temperature that is typically three or four times lower. This translates into equivalent locally isothermal models with h that is lower by 3 − 4%. By inspecting Fig. 1 (top left plot), we note that in this range of aspect ratios, the disk’s eccentricity actually changes quickly with h. This might explain why less massive radiative disks have different disk eccentricities. Even self-gravity will play a minor role for less massive disks and in Paper I we showed that self-gravity indeed is effective in reducing the disk eccentricity. This, however, is not the full story and the different energy equation also plays a significant role. The disk eccentricity radial profile of radiative disks, in addition to those of the less massive ones (see Fig. 14), does not peak close to the star in a similar way to the isothermal disks (Fig. 1). The value of ed for radiative disks grows for larger values of R as predicted by the analytical theory of Paardekooper et al. (2008). This behaviour is further illustrated by examining the Fourier components of the normalized surface density. Figure 16 compares the Fourier components for both our standard disk with Σ0 = ΣMMSN, and the disk model with Σ0 = 0.1ΣMMSN. The m = 1 and m = 2 components are much stronger for the less massive disk, and they account for the overall higher disk eccentricity. In the standard case, the high disk density is able to efficiently damp the two Fourier components of the binary perturbations as they move toward the disk inner parts.
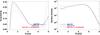 |
Fig. 9 Eccentricity and surface density profiles, time-averaged between 35 and 40 binary orbits, obtained with the locally isothermal disk model with imposed temperature profile, using three different boundary conditions at the inner edge: (i) our standard zero-gradient outflow boundary (labeled as open, solid curve), (ii) a viscous outflow boundary (labeled as viscous, dash-dotted curve, see text), and (iii) our standard zero-gradient outflow boundary with the azimuthal velocity at the inner edge extrapolated from that in the first active ring (dashed curve). |
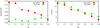 |
Fig. 11 Disk eccentricity (left plot) for different values of the binary eccentricity eb. The average of ed is displayed after 70 binary revolutions, and time-averaging is done over 20 revolutions. For comparison, we also depict the corresponding values of ed for isothermal disks with same binary configurations (Marzari et al. 2009). In the right plot, we show the disk size for different values of eb, more specifically the semi-major axis of the ellipse that most closely fits the disk density at a level Σ = 10-6 (code units). |
On the other hand, these components propagate to greater depths in less massive disks, leading to a larger value for ed. However, in the less massive disk these components also do not reach the inner part of the disk, as in isothermal disks, preventing the formation of an eccentric low-density region close to the central star.
According to the results presented so far, isothermal and radiative disks behave differently. Massive isothermal disks in low eccentricity binaries are expected to be eccentric for reasonable values of h while radiative disks always have low eccentricity.
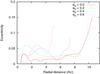 |
Fig. 12 Azimuthally-averaged eccentricity profiles for radiative disks with different binary eccentricities, displayed at 100 binary orbits. Instantaneous profiles are depicted to better highlight the dependence of ed with eb. |
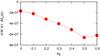 |
Fig. 13 Mass loss rate of radiative disks (in M⊙/yr) for different values of eb obtained by applying a linear fit to the time evolution of the disk mass after the initial fast truncation. |
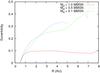 |
Fig. 14 Azimuthally- and time-averaged profiles of the disk’s eccentricity for three different initial surface densities: Σ0 = ΣMMSN (our fiducial value), Σ0 = 0.5ΣMMSN, and Σ0 = 0.1ΣMMSN. |
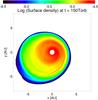 |
Fig. 15 Contours of the gas density after 150 binary revolutions for a radiative disk with Σ0 = 0.1ΣMMSN. |
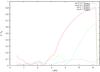 |
Fig. 16 m = 1 and m = 2 Fourier components of the normalized surface density for a radiative disk with Σ0 = ΣMMSN, and a radiative disk that is initially ten times less massive (Σ0 = 0.1ΣMMSN). |
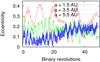 |
Fig. 17 Planetesimal orbital evolution without the gas drag force. High values of eccentricity are excited by the inhomogeneous distribution of mass within the disk. The highest eccentricity value is observed closer to the star where the companion gravitational perturbations are weaker. |
For isothermal disks, there is a weak dependence of the disk eccentricity on the disk mass (see Paper I), while for radiative disks, this dependence is strong with less massive disks being more eccentric. Hot isothermal disks develop an inner eccentric hole, while radiative disks arei also smooth at the inner edge.
5. Why is disk eccentricity so important? Planetesimals!
The shape and profile of the gas disk may have a crucial role in the early stages of planetary formation, when kilometer-sized planetesimals are colliding with each other. Even when neglecting gas disk gravity, several studies have shown that the coupling between secular perturbations and gas drag, which increases impact velocities between non-equal sized bodies and can lead to accretion-hostile environments (e.g. Thébault et al. 2006, 2008, 2009), leads to an increase in the relative velocity between planetesimals if the gas disk becomes eccentric (Paardekooper et al. 2008; Xie et al. 2010). Disk gravity might further increase the impact velocities by increasing the disk eccentricity and inducing additional dynamical perturbations on planetesimals because of the non-isotropic distribution of the mass within the gas disk. The asymmetric distribution of mass within a massive disk can indeed significantly perturb the orbit of planetesimals, causing relatively high eccentricities and unphased orbits, which may possibly halt the accretion process.
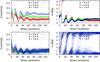 |
Fig. 18 Orbital evolution of planetesimals with different sizes close to the primary star (upper plots, a = 1.5 AU), and farther out (lower plots, a = 3.5 AU). The black line on the left plots show the value of the forced eccentricity of the companion star. |
To test this hypothesis, we integrated the trajectories of planetesimals orbiting within 6 AU from the primary star, and we computed their orbital evolution in 2D under the action of (i) stellar gravity, (ii) gas drag, and (iii) gas disk gravity. This procedure has been implemented in previous papers, but with different assumptions such as isothermal disk models, no self-gravity, and different binary parameters (Paardekooper et al. 2008; Kley & Nelson 2008). We first present in Fig. 17 the results of a test run without gas drag, for which we see that the planetesimals eccentricity grows to large values regardless of their initial location in the disk. In addition, the drift towards the inner region of the disk, which is typical of planetesimals around single stars, may be halted and even reversed. This drag-free case could probably describe the evolution of large planetesimals, 100 km or bigger, which are not significantly affected by gas drag. For the disk and star parameters, we consider our standard case.
We present the results of a full simulation including gas drag given by the usual formulae Fd = K |vrel| vrel, where vrel is the relative velocity vector of the planetesimal with respect to the gas, and the drag parameter K is equal to ρgCd/(8ρpls) (Kary et al. 1993), where s is the radius of a given planetesimal, ρpl its mass density, ρg the gas density of the protoplanetary disk, and Cd a dimensionless drag coefficient related to the planetesimal shape (~0.4 for spherical bodies). We explore three values for K, corresponding to 10, 20, and 50 km-sized planetesimals in a MMSN disk, and we consider two initial locations for the planetesimals: 1.5 AU and 3.5 AU from the primary. For the 1.5 AU case, the initial strong perturbations of the eccentric disk are partly damped by gas drag but the steady state eccentricities are much higher than the forced eccentricity of the companion star (see Fig. 18, upper box). Moreover, these steady-state eccentricities do strongly vary with K, i.e. with planetesimal sizes: they are almost twice as large for 50 km-sized objects as for 10 km-sized ones. As for the pericenter longitudes, they rapidly converge to steady state values that only marginally vary with planetesimal size. The evolution of the 3.5 AU case is different. The eccentricities decrease towards an equilibrium value predicted by the balancing between the forced component of the companion star, gas drag damping and disk gravity (see Fig. 18, lower plots). The steady state eccentricities are thus lower than in the 1.5 AU case, despite being in a region where secondary perturbations are stronger. This result is in sharp contrast to the results of Paardekooper et al. (2008) for the gas drag-only case, where eccentricities steadily increase with increasing semi-major axis (see Fig. 10b of that paper). These results clearly illustrated that the gas disk gravity, which is stronger in the inner and denser parts of the system, is the dominant mechanism controlling the planetesimals’ dynamical evolution. The residual short-term variations in the eccentricity, caused by the companion’s perturbations, are in contrast much larger in the 3.5 AU case than in the 1.5 AU one. The pericenter alignment is maintained at this distance even if it is less collimated, as expected since the gas density is lower.
Assessing the consequences of these dynamical behaviors on the accretion process would require estimating the distribution of impact velocities, vcoll, among the planetesimal population. It would be impossible to directly derive vcoll from the values of the eccentricity because of mutual orbital phasing. The simple vcoll ∝ ⟨ e ⟩ relation is in this case no longer valid and should be replaced by vcoll ∝ αP ⟨ e ⟩ , where the factor αP < 1 accounts for the phasing. Unfortunately, proper velocity estimates are difficult to derive with the limited number of planetesimals (50) considered here. Simulations with at least a few thousands test particles would be necessary (e.g. Thébault et al. 2006; Paardekooper et al. 2008; Xie & Zhou 2009), but these numbers are beyond the current computing capacities for a full model including the gas disk’s gravity. However, the preliminary results displayed in Figs. 17 and 18 seem to indicate that encounter velocities are probably increased by the action of disk gravity for two reasons: (i) even if a significant orbital phasing is observed (right hand plots of Fig. 18) it is nevertheless imperfect, especially in the 3.5 AU case. Even in the 1.5 AU case it is size-dependent, which increases the factor αP in any realistic planetesimal population with a size distribution; (ii) the values of the steady-state eccentricities are higher than in the gas-drag-only case, especially closer to the star where velocities are relatively low in the gas-drag-only runs (compare for example the upper-left graph of Figs. 18 to 10 of Paardekooper et al. 2008). These steady-state eccentricities are in addition strongly size-dependent. These two effects separately increase each of the two components, αP and ⟨ e ⟩ , controlling the value of the encounter velocities. The extent of this velocity growth, and thus its concrete effect on the accretion process, cannot be quantitatively estimated here. It will be the purpose of a forthcoming study to specifically address this issue. We are however confident that the general trend is for disk gravity to act against planetesimal accretion.
6. Concluding remarks
We have shown that the evolution of a circumstellar disk in close binary-star systems strongly depends on the disk’s mass and thermodynamical properties. In locally isothermal disk models, where the temperature profile remains constant with time, the average eccentricity in the disk inner parts changes dramatically when the disk temperatures are varied (or, equivalently, the disk aspect ratios h = H/r), as illustrated in Fig. 1. In our model, the disk eccentricity typically peaks at ≈ 0.4 for h ≈ 0.05. Such high eccentricities result in the formation of an internal elliptic low-density region in the disk. Radiative disks, on the other hand, have smoother density profiles, and their eccentricity takes smaller values than in locally isothermal models with similar temperature profiles. Radiative damping of the waves induced by the secondary companion helps to maintain the disk eccentricity to a fairly low value, which in our model typically amounts to ~0.05 in the disk inner parts.
In both locally isothermal and radiative disks, self-gravity causes the libration of the disk orientation at an angle π with respect to the apsidal line of the binary orbit. However, the libration is incoherent within the disk, and the orientation of the gas streamlines changes with radial distance.
The average disk eccentricity in radiative disks is almost insensitive to the binary’s eccentricity, although it should slowly increase with time as the disk mass decreases owing to its viscous evolution. A disk that is ten times less massive than our nominal disk (that is, for which Σ0 = 0.1ΣMMSN) has a high eccentricity (about 0.3 for eb = 0.4). This behavior is not observed in locally isothermal disks.
On the basis of these different behaviors, we may envision an evolutionary track for disks in binaries. In the earlier stages, the disk is massive and probably optically thick, so it is welli-described by radiative models. Its eccentricity should therefore remain small, around 0.05, and its radial density profile be smooth. Later, owing to the viscous evolution, the disk progressively loses mass. This occurs at a relatively high rate for binaries with high values of eb (see Fig. 11). If the disk is still optically thick and the radiative model is appropriate, the disk eccentricity is expected to grow because of the dependence of ed on disk mass (see Fig. 14). If, finally, the disk becomes optically thin, a locally isothermal equation of state may then be more appropriate. In this case, the disk eccentricity will change and depend on eb as shown in Marzari et al. (2009). At the same time, hotter disks will develop an internal elliptic hole, which represents a significant decrease in the gas density at the inner edge of the disk. This scenario can be tested by deriving from observations the disk eccentricity using, ad example, the mothod suggested in Regály et al. (2011).
The asymmetric distribution of mass caused by the differential libration of the disk orientation and the overall disk eccentric shape, causes significant perturbations to planetesimals. Their eccentricity is driven to values that are significantly higher than those caused only by the secular perturbations of the binary companion. Even when gas drag is included, the perturbations by the eccentric disk entail high planetesimal eccentricities, in particular in the inner zones of the disk. It is necessary to evaluate the impact of this eccentricity on the accumulation process of planetesimals.
Acknowledgments
We thank an anonymous referee for his useful comments and suggestions that helped to improve the paper. C.B. acknowledges support from a Herchel Smith Postdoctoral Fellowship. Part of the numerical simulations were performed using the Pleiades Cluster at U.C. Santa Cruz. We also gratefully acknowledge the computing time provided by the Mesocentre SIGAMM machine, which is hosted by the Observatoire de la Côte d’Azur.
References
- Baruteau, C., & Masset, F. 2008, ApJ, 678, 483 [NASA ADS] [CrossRef] [Google Scholar]
- Bell, K. R., & Lin, D. N. C. 1994, ApJ, 427, 987 [NASA ADS] [CrossRef] [Google Scholar]
- Bonavita, M., & Desidera, S. 2007, A&A, 468, 721 [NASA ADS] [CrossRef] [EDP Sciences] [Google Scholar]
- Cassen, P., & Woolum, D. S. 1996, ApJ, 472, 789 [NASA ADS] [CrossRef] [Google Scholar]
- Desidera, S., & Barbieri, M. 2007, A&A, 462, 345 [NASA ADS] [CrossRef] [EDP Sciences] [Google Scholar]
- Duquennoy, A., & Mayor, M. 1991, A&A, 248, 485 [NASA ADS] [Google Scholar]
- Ghez, A. M., Neugebauer, G., & Matthews, K. 1993, AJ, 106, 2005 [Google Scholar]
- Goodman, J., & Rafikov, R. R. 2001, ApJ, 552, 793 [NASA ADS] [CrossRef] [Google Scholar]
- Holman, M. J., & Wiegert, P. A. 1999, AJ, 117, 621 [NASA ADS] [CrossRef] [Google Scholar]
- Hubeny, I. 1990, ApJ, 351, 632 [NASA ADS] [CrossRef] [Google Scholar]
- Kary, D. M., Lissauer, J. J., & Greenzweig, Y. 1993, Icarus, 106, 288 [NASA ADS] [CrossRef] [Google Scholar]
- Kley, W., & Nelson, R. P. 2008, A&A, 486, 617 [NASA ADS] [CrossRef] [EDP Sciences] [Google Scholar]
- Kley, W., Papaloizou, J. C. B., & Ogilvie, G. I. 2008, A&A, 487, 671 [NASA ADS] [CrossRef] [EDP Sciences] [Google Scholar]
- Koerner, D. W., Sargent, A. I., & Beckwith, S. V. W. 1993, Icarus, 106, 2 [NASA ADS] [CrossRef] [Google Scholar]
- Lubow, S. H. 1991a, ApJ, 381, 259 [NASA ADS] [CrossRef] [Google Scholar]
- Lubow, S. H. 1991b, ApJ, 381, 268 [NASA ADS] [CrossRef] [Google Scholar]
- Marzari, F., & Scholl, H. 2000, ApJ, 543, 328 [NASA ADS] [CrossRef] [Google Scholar]
- Marzari, F., Scholl, H., Thébault, P., & Baruteau, C. 2009, A&A, 508, 1493 [NASA ADS] [CrossRef] [EDP Sciences] [Google Scholar]
- Monin, J.-L., Clarke, C. J., Prato, L., & McCabe, C. 2007, Protostars and Planets V, 395 [Google Scholar]
- Mugrauer, M., & Neuhäuser, R. 2009, A&A, 494, 373 [NASA ADS] [CrossRef] [EDP Sciences] [Google Scholar]
- Paardekooper, S.-J., & Leinhardt, Z. M. 2010, MNRAS, 403, L64 [NASA ADS] [Google Scholar]
- Paardekooper, S.-J., Thébault, P., & Mellema, G. 2008, MNRAS, 386, 973 [NASA ADS] [CrossRef] [Google Scholar]
- Paardekooper, S., Baruteau, C., & Kley, W. 2011, MNRAS, 410, 293 [NASA ADS] [CrossRef] [Google Scholar]
- Petr-Gotzens, M. G., Daemgen, S., & Correia, S. 2010, in ASP Conf. Ser. 435, ed. A. Prša, & M. Zejda, 429 [Google Scholar]
- Pierens, A., & Nelson, R. P. 2007, A&A, 472, 993 [NASA ADS] [CrossRef] [EDP Sciences] [Google Scholar]
- Prato, L., Greene, T. P., & Simon, M. 2003, ApJ, 584, 853 [NASA ADS] [CrossRef] [Google Scholar]
- Regály, Z., Sándor, Z., Dullemond, C. P., & Kiss, L. L. 2011, A&A, 528, A93 [NASA ADS] [CrossRef] [EDP Sciences] [Google Scholar]
- Rodríguez, L. F., D’Alessio, P., Wilner, D. J., et al. 1998, Nature, 395, 355 [NASA ADS] [CrossRef] [Google Scholar]
- Stapelfeldt, K. R., Krist, J. E., Menard, F., et al. 1998, ApJ, 502, L65 [NASA ADS] [CrossRef] [Google Scholar]
- Stone, J. M., & Norman, M. L. 1992, ApJS, 80, 753 [Google Scholar]
- Thébault, P., Marzari, F., & Scholl, H. 2006, Icarus, 183, 193 [NASA ADS] [CrossRef] [Google Scholar]
- Thébault, P., Marzari, F., & Scholl, H. 2008, MNRAS, 388, 1528 [NASA ADS] [CrossRef] [Google Scholar]
- Thébault, P., Marzari, F., & Scholl, H. 2009, MNRAS, 393, L21 [NASA ADS] [CrossRef] [Google Scholar]
- Trilling, D. E., Stansberry, J. A., Stapelfeldt, K. R., et al. 2007, ApJ, 658, 1289 [NASA ADS] [CrossRef] [Google Scholar]
- van Leer, B. 1977, J. Comp. Phys., 23, 276 [Google Scholar]
- Xie, J.-W., & Zhou, J.-L. 2009, ApJ, 698, 2066 [NASA ADS] [CrossRef] [Google Scholar]
- Xie, J.-W., Zhou, J.-L., & Ge, J. 2010, ApJ, 708, 1566 [NASA ADS] [CrossRef] [Google Scholar]
All Figures
|
Fig. 1 Azimuthally and time-averaged profiles of the disk’s eccentricity (left column) and surface density (Σ, right column) obtained with the series of locally isothermal disk models described in Sect. 3. In the density profile plot we include the initial, unperturbed profile, which is shown as reference. Results are shown at 60 orbits of the secondary, and time-averaging is done over 5 orbits. Several values of the disk’s aspect ratio at 1 AU are considered and two secondary-to-primary mass ratios of q = 0.4 (upper panels) and q = 0.1 (lower panels). |
| In the text | |
|
Fig. 2 Azimuthally averaged profile of the disk’s pericenter in the locally isothermal disk model with h = 0.05 and q = 0.4 and in the radiative case. It is computed after 100 orbits of the secondary star. |
| In the text | |
|
Fig. 3 Instantaneous Fourier components of the disk’s surface density for the locally isothermal disk models of Sect. 3 with h = 0.02 (left panel) and h = 0.06 (right panel), respectively. Results are shown at t = 2550 yr (that is, after about 20 orbits of the secondary), and are obtained with q = 0.4. The azimuthal wavenumber for each Fourier component is indicated in the top-right corner of each panel. |
| In the text | |
|
Fig. 4 Contours of the gas density after 90 binary revolutions. Results with an energy equation are shown in the left part of this figure, and those with a locally isothermal equation of state with a fixed temperature profile are shown in the right part. The upper plots are for eb = 0.4 and the lower plots for eb = 0.0. The same initial aspect ratio (h = 0.05) is used in these simulations. |
| In the text | |
|
Fig. 5 Time evolution of the averaged disk eccentricity ed (upper panel) and pericenter longitude ϖd (lower panel) for the locally isothermal and radiative runs of Sect. 4.1. |
| In the text | |
|
Fig. 6 Time- and azimuthally-averaged disk eccentricity, density and temperature profiles for our radiative disk model and various locally isothermal disk models: (i) one with the same initial aspect ratio as in the radiative model (h = 0.05), (ii) one with the same temperature profile as in the radiative model, and (iii) another with same sound speed profile as in the radiative model. |
| In the text | |
|
Fig. 7 Contours of the disk surface density for the radiative model (left panel), and the locally isothermal model with same imposed temperature profile as in the radiative case (right panel). In the radiative case, spiral waves appear smoother and more damped. |
| In the text | |
|
Fig. 8 Disk eccentricity and temperature profiles (azimuthally and time-averaged) for our standard radiative model (labeled as Q − × 1), and for two restart simulations with different cooling rates. The disk eccentricity is higher in the restart run with a lower cooling rate (10-3 × Q − ), while it is lower in the restart simulation with a higher cooling rate (10 × Q − ). |
| In the text | |
|
Fig. 9 Eccentricity and surface density profiles, time-averaged between 35 and 40 binary orbits, obtained with the locally isothermal disk model with imposed temperature profile, using three different boundary conditions at the inner edge: (i) our standard zero-gradient outflow boundary (labeled as open, solid curve), (ii) a viscous outflow boundary (labeled as viscous, dash-dotted curve, see text), and (iii) our standard zero-gradient outflow boundary with the azimuthal velocity at the inner edge extrapolated from that in the first active ring (dashed curve). |
| In the text | |
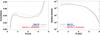 |
Fig. 10 Same as in Fig. 9, but for our standard radiative disk model. |
| In the text | |
|
Fig. 11 Disk eccentricity (left plot) for different values of the binary eccentricity eb. The average of ed is displayed after 70 binary revolutions, and time-averaging is done over 20 revolutions. For comparison, we also depict the corresponding values of ed for isothermal disks with same binary configurations (Marzari et al. 2009). In the right plot, we show the disk size for different values of eb, more specifically the semi-major axis of the ellipse that most closely fits the disk density at a level Σ = 10-6 (code units). |
| In the text | |
|
Fig. 12 Azimuthally-averaged eccentricity profiles for radiative disks with different binary eccentricities, displayed at 100 binary orbits. Instantaneous profiles are depicted to better highlight the dependence of ed with eb. |
| In the text | |
|
Fig. 13 Mass loss rate of radiative disks (in M⊙/yr) for different values of eb obtained by applying a linear fit to the time evolution of the disk mass after the initial fast truncation. |
| In the text | |
|
Fig. 14 Azimuthally- and time-averaged profiles of the disk’s eccentricity for three different initial surface densities: Σ0 = ΣMMSN (our fiducial value), Σ0 = 0.5ΣMMSN, and Σ0 = 0.1ΣMMSN. |
| In the text | |
|
Fig. 15 Contours of the gas density after 150 binary revolutions for a radiative disk with Σ0 = 0.1ΣMMSN. |
| In the text | |
|
Fig. 16 m = 1 and m = 2 Fourier components of the normalized surface density for a radiative disk with Σ0 = ΣMMSN, and a radiative disk that is initially ten times less massive (Σ0 = 0.1ΣMMSN). |
| In the text | |
|
Fig. 17 Planetesimal orbital evolution without the gas drag force. High values of eccentricity are excited by the inhomogeneous distribution of mass within the disk. The highest eccentricity value is observed closer to the star where the companion gravitational perturbations are weaker. |
| In the text | |
|
Fig. 18 Orbital evolution of planetesimals with different sizes close to the primary star (upper plots, a = 1.5 AU), and farther out (lower plots, a = 3.5 AU). The black line on the left plots show the value of the forced eccentricity of the companion star. |
| In the text | |
Current usage metrics show cumulative count of Article Views (full-text article views including HTML views, PDF and ePub downloads, according to the available data) and Abstracts Views on Vision4Press platform.
Data correspond to usage on the plateform after 2015. The current usage metrics is available 48-96 hours after online publication and is updated daily on week days.
Initial download of the metrics may take a while.