Fig. 8
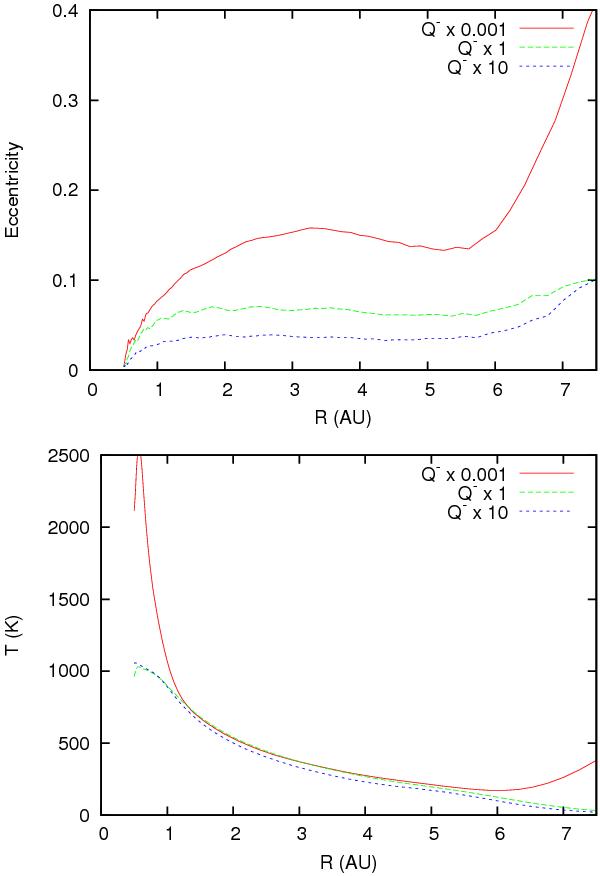
Disk eccentricity and temperature profiles (azimuthally and time-averaged) for our standard radiative model (labeled as Q − × 1), and for two restart simulations with different cooling rates. The disk eccentricity is higher in the restart run with a lower cooling rate (10-3 × Q − ), while it is lower in the restart simulation with a higher cooling rate (10 × Q − ).
Current usage metrics show cumulative count of Article Views (full-text article views including HTML views, PDF and ePub downloads, according to the available data) and Abstracts Views on Vision4Press platform.
Data correspond to usage on the plateform after 2015. The current usage metrics is available 48-96 hours after online publication and is updated daily on week days.
Initial download of the metrics may take a while.