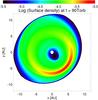
Fig. 4
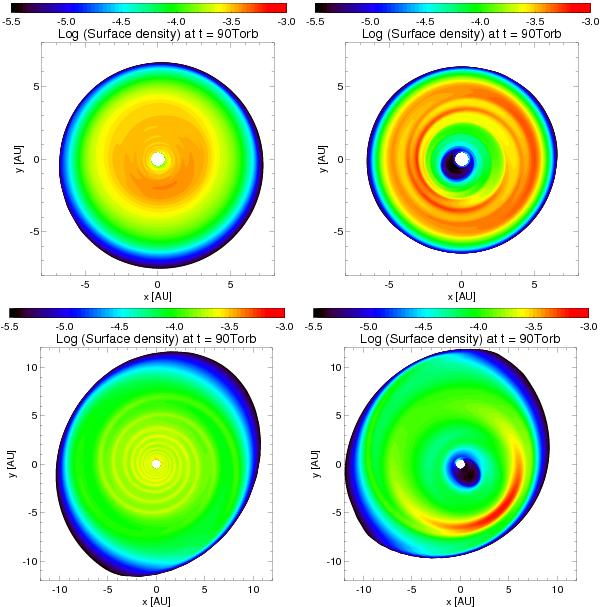
Contours of the gas density after 90 binary revolutions. Results with an energy equation are shown in the left part of this figure, and those with a locally isothermal equation of state with a fixed temperature profile are shown in the right part. The upper plots are for eb = 0.4 and the lower plots for eb = 0.0. The same initial aspect ratio (h = 0.05) is used in these simulations.
Current usage metrics show cumulative count of Article Views (full-text article views including HTML views, PDF and ePub downloads, according to the available data) and Abstracts Views on Vision4Press platform.
Data correspond to usage on the plateform after 2015. The current usage metrics is available 48-96 hours after online publication and is updated daily on week days.
Initial download of the metrics may take a while.