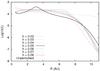
Fig. 1
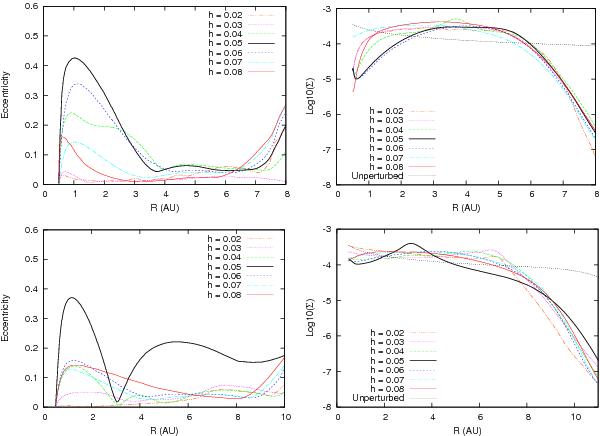
Azimuthally and time-averaged profiles of the disk’s eccentricity (left column) and surface density (Σ, right column) obtained with the series of locally isothermal disk models described in Sect. 3. In the density profile plot we include the initial, unperturbed profile, which is shown as reference. Results are shown at 60 orbits of the secondary, and time-averaging is done over 5 orbits. Several values of the disk’s aspect ratio at 1 AU are considered and two secondary-to-primary mass ratios of q = 0.4 (upper panels) and q = 0.1 (lower panels).
Current usage metrics show cumulative count of Article Views (full-text article views including HTML views, PDF and ePub downloads, according to the available data) and Abstracts Views on Vision4Press platform.
Data correspond to usage on the plateform after 2015. The current usage metrics is available 48-96 hours after online publication and is updated daily on week days.
Initial download of the metrics may take a while.