Fig. 11
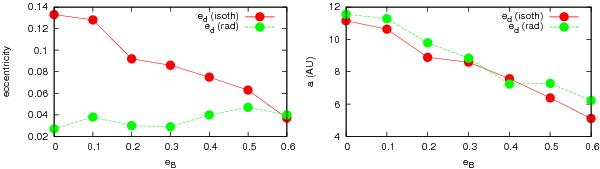
Disk eccentricity (left plot) for different values of the binary eccentricity eb. The average of ed is displayed after 70 binary revolutions, and time-averaging is done over 20 revolutions. For comparison, we also depict the corresponding values of ed for isothermal disks with same binary configurations (Marzari et al. 2009). In the right plot, we show the disk size for different values of eb, more specifically the semi-major axis of the ellipse that most closely fits the disk density at a level Σ = 10-6 (code units).
Current usage metrics show cumulative count of Article Views (full-text article views including HTML views, PDF and ePub downloads, according to the available data) and Abstracts Views on Vision4Press platform.
Data correspond to usage on the plateform after 2015. The current usage metrics is available 48-96 hours after online publication and is updated daily on week days.
Initial download of the metrics may take a while.