| Issue |
A&A
Volume 698, June 2025
|
|
|---|---|---|
| Article Number | A205 | |
| Number of page(s) | 15 | |
| Section | Atomic, molecular, and nuclear data | |
| DOI | https://doi.org/10.1051/0004-6361/202554558 | |
| Published online | 17 June 2025 | |
Experimental and computational investigation of an ionic pathway to the formation of silicon sulphide in the interstellar medium
1
Dipartimento di Fisica, Università di Trento,
Via Sommarive 14,
38123
Trento,
Italy
2
Dipartimento di Chimica, Biologia e Biotecnologie, Università degli Studi di Perugia,
via Elce di Sotto, 8,
06123
Perugia,
Italy
3
Dipartimento di Ingegneria Civile ed Ambientale, Università degli Studi di Perugia, via G. Duranti,
Perugia,
Italy
4
Univ. Grenoble Alpes, CNRS, Institut de Planétologie et d’Astrophysique de Grenoble (IPAG),
38000
Grenoble,
France
★★ Corresponding authors: This email address is being protected from spambots. You need JavaScript enabled to view it.
; This email address is being protected from spambots. You need JavaScript enabled to view it.
Received:
16
March
2025
Accepted:
15
April
2025
Abstract
Context. Silicon is the eighth most abundant element of the Sun’s photosphere and neighbourhood. Despite it being mostly trapped in dust grains, some Si-bearing molecules have been detected in several interstellar and circumstellar sources. Silicon sulphide (SiS) is considered a relevant tracer for shocked regions and some neutral-neutral reactions have been investigated to pinpoint its formation routes. In contrast, a detailed laboratory characterisation of the contribution of ion-molecule reactions is lacking.
Aims. Here, we analyse the role of the Si+ + H2S reaction as a source of protonated SiS. Furthermore, we characterise the conversion of protonated SiS into its neutral counterpart via a proton-transfer-reaction with ammonia (i.e. an additional process with respect to electron-ion recombination).
Methods. The reaction of Si+ with H2S has been experimentally studied by measuring absolute cross-sections (CSs) and branching ratios (BRs), as a function of collision energy. Experiments have been supported by a theoretical investigation combining high-level electronic structure calculations of the multi-dimensional doublet potential energy surface (PES) of the SiH2S+ system with a kinetic investigation. This allowed us to derive BRs and channel-specific rate constants as a function of temperature in the 10–300 K range. Stereo-dynamical constraints on the total rate constants were modelled by introducing an energy threshold that is dependent on the relative orientation of the reagents.
Results. The main product of the reaction (with a BR in the range 95–98.6%) has been assigned to the SiSH+ ion, with the support of theoretical calculations. Furthermore, SiS+ has also been detected as a minor product. From the total reactive CS, measured as a function of collision energy, rate constant as a function of temperature have been estimated, with values increasing with temperature from k = 7.0 × 10⁻¹¹ (at 10 K) to 7.0 × 10⁻¹⁰ cm3 s−1 (at 300 K), in contrast to capture model predictions, demonstrating an increase with decreasing temperature. The proton transfer reactions between SiSH+ and NH3 is found to be efficient with a rate constant of 9.7 × 10⁻¹⁰ cm3 s−1 that does not depend on temperature.
Conclusions. In addition to neutral-neutral reactions, the ionic route here proposed can contribute or even dominate the formation of SiS in protostellar shocked regions, where atomic Si released from grains can be easily converted into Si+ due to its low ionisation energy.
Key words: astrochemistry / molecular data / astronomical databases: miscellaneous / ISM: jets and outflows / ISM: molecules
M. Michielan and L. Mancini contributed equally to the present work.
© The Authors 2025
 Open Access article, published by EDP Sciences, under the terms of the Creative Commons Attribution License (https://creativecommons.org/licenses/by/4.0), which permits unrestricted use, distribution, and reproduction in any medium, provided the original work is properly cited.
This article is published in open access under the Subscribe to Open model. This email address is being protected from spambots. You need JavaScript enabled to view it. to support open access publication.
1 Introduction
Silicon is the eighth most abundant element in the Sun’s photosphere and neighborhood (Asplund et al. 2009; Peng et al. 2013; Lodders 2020). Its astrochemical relevance is unquestionable since in its refractory forms, it is a key component of interstellar dust grains, which are the major UV photons absorption source and whose surfaces provide a site for heterogenous interstellar chemistry to take place (Li & Draine 2001; Draine 2003; Herbst et al. 2005). Thus far, more than 20 Si-bearing molecules have been detected in several astronomical sources, ranging from diatomics up to molecules containing eight atoms (Müller et al. 2001), including organosilicon compounds (e.g. SiH3CN, CH3SiH3, (Cernicharo et al. 2017)) as well as inorganic molecules, such as SiO, SiS, SiC (Cernicharo et al. 1989), c-SiCn (with n = 2, 3) (Massalkhi et al. 2023; Apponi et al. 1999), SiC4 (Ohishi et al. 1989), SiN (Turner 1987; Schilke et al. 2003), SiH4 (Goldhaber & Betz 1984), and SiCSi (Cernicharo et al. 2015). By analysing the sources where these molecules are observed, it is clear that the regions where gas-phase Si-bearing molecules are abundant are those where silicate grains are either partially destroyed by shocks (e.g. those created by protostellar ejections) or they have not yet formed (e.g. in evolved stars). In addition, atomic silicon has been detected in protostellar shocks (Gry et al. 1999) and in the coma of comet 67P/Churyumov-Gerasimenko, likely originating by evaporation from (nano)grains present in the cometary coma (Rubin et al. 2022). Finally, ionised atomic Si has been detected in the surroundings of young stellar objects (Lorenzetti et al. 1999). Silicon and silicates (SiO, SiO2) are also expected to be present in the tenuous, but potentially observable (e.g. with the sensitivity provided by James Webb Space Telescope) atmospheres of the so-called ‘lava worlds’, which are a class of rocky exoplanets orbiting so close to their stars that they reach dayside temperatures high enough to melt their silicate crusts (Zilinskas et al. 2022, 2023).
Silicon sulphide (SiS) was first detected in the circumstellar shell IRC+10216 (Morris et al. 1975), in Sgr B2 and Orion A (Dickinson & Kuiper 1981; Turner 1987), as well as in the shocked gas of the low-mass protostellar outflow L1157-B1 (Podio et al. 2017). In shocked regions, SiO (silicon monoxide) is widely observed, whereas SiS has been detected only toward the above-mentioned sources. In Sgr B2 and Orion A, the SiO/SiS abundance ratio is about 200:1, while in L1157-B1 it is about 25. The reason for this enhancement of SiS in L1157-B1 has not yet been explained.
More generally, the origin of interstellar SiS is still a matter of debate. Several formation routes have been explored in dedicated experimental or theoretical works, with most of the attention focussed on neutral-neutral reactions. Some examples are: 1) SiH + S → SiS + H (Rosi et al. 2018; Galvão et al. 2023); 2) SiH + S2 → SiS + HS (Rosi et al. 2018); 3) Si + H2S → SiS + H2 (explored from an experimental and theoretical point of view by Doddipatla et al. 2021); 4) Si + SH → SiS + H (Rosi et al. 2019; Mota et al. 2021, 2022); 5) SH + SiH → SiS + H2; 6) S +SiC, with the possible formation of either SiS + C or CS + Si (Mendoza, Edgar et al. 2024); 7) Si + SO with the possible formation of either SiS + O or SiO + S (Zanchet et al. 2018), SiH2 + SH and SiH2 + H2S (Fortenberry & McGuire 2024); and 8) the radiative association of Si with S by Andreazza & Marinho (2007).
Much less is known about possible formation routes based on ion-molecule reactions. The only SiS formation pathway considered in KInetic Database for Astrochemistry (KIDA, Wakelam et al. 2024; Wakelam et al. 2015) and UMIST Database for Astrochemistry (UDfA, Millar et al. 2024) is the electron recombination of protonated SiS. Overall, HSiS+ is assumed to be mainly produced either in the sequence of reactions: (1) Si+ + OCS → SiS+ + CO followed by SiS+ + H2 → HSiS+ + H or via (2) ![Mathematical equation: $\[\mathrm{Si}^{+}+\mathrm{H}_{2} \rightarrow \mathrm{SiH}_{2}^{+}\]$](/articles/aa/full_html/2025/06/aa54558-25/aa54558-25-eq1.png) (radiative association) followed by
(radiative association) followed by ![Mathematical equation: $\[\mathrm{S}+\mathrm{SiH}_{2}^{+} \rightarrow \mathrm{HSiS}^{+}+\mathrm{H}\]$](/articles/aa/full_html/2025/06/aa54558-25/aa54558-25-eq2.png) . However, laboratory experiments have shown that SiS+ and Si+ do not react with H2 (Wlodek et al. 1987; Wlodek & Bohme 1989). Therefore, at present, KIDA and UMIST do not contain efficient HSiS+ formation routes (even though other formation routes of
. However, laboratory experiments have shown that SiS+ and Si+ do not react with H2 (Wlodek et al. 1987; Wlodek & Bohme 1989). Therefore, at present, KIDA and UMIST do not contain efficient HSiS+ formation routes (even though other formation routes of ![Mathematical equation: $\[\mathrm{SiH}_{2}^{+}\]$](/articles/aa/full_html/2025/06/aa54558-25/aa54558-25-eq3.png) are present in the network of reactions). A feasible formation route of HSiS+ was recently reported by Mancini et al. (2022), who characterised the S+ + SiH2 reaction via quantum chemistry, but its results have not yet been tested in models.
are present in the network of reactions). A feasible formation route of HSiS+ was recently reported by Mancini et al. (2022), who characterised the S+ + SiH2 reaction via quantum chemistry, but its results have not yet been tested in models.
Quite surprisingly, the Si+ + H2S reaction was never considered in astrochemical models, notwithstanding the experiments carried out by Glosík et al. (1995), which demonstrated that this reaction is an efficient source of HSiS+. In fact, the reactions of Si+ with H2S and other simple molecules were the subject of experimental investigations in the past, using flow tube techniques (see Wlodek & Bohme 1989; Glosík et al. 1995) and the rate coefficients as a function of temperature (or collision energy) were obtained. However, due to the relatively high pressure and number density of those experiments, multiple collisions can occur (as evidenced by the identification of the adduct) and some uncertainty remains. In this work, we report the first experimental determination by the guided ion beam (GIB) technique of the total reactive cross sections (CSs) and branching ratios (BRs) as a function of the collision energy in the 0.1 − 10 eV range for the Si+ + H2S reaction. This technique allows us to better reproduce the low number density conditions of the ISM by operating under almost single-collision conditions. In addition, theoretical calculations of the reaction potential energy surface (PES) have been carried out at the coupled-cluster level of theory (CCSD(T)) and statistical RRKM calculations of the BRs have been obtained. Theoretical predictions assist the interpretation of the experimental results and help to identify the protonated isomer measured at m/z 61 (SiSH+ vs HSiS+) and to assess whether SiS+ + H2 is also a minor channel, as the experimental results suggest. A phenomenological treatment of the reaction mechanism has also been developed to overcome simple capture models and successfully reproduce the main experimental findings. The most relevant features driving the reactivity at the low temperatures typical of interstellar environments have been elucidated in such a way.
Finally, we have also considered, as a possible alternative to electron-ion recombination, the formation of neutral SiS via proton-transfer from SiSH+ to ammonia. This possibility was recently discussed anew in Taquet et al. (2016) in the context of the synthesis of interstellar complex organic molecules, starting from their protonated counterparts.
2 Theoretical methods
2.1 Electronic structure calculations
The potential energy surfaces for the reactions of Si+ + H2S and SiSH+ + NH3 were investigated by adopting a computational strategy previously used for the characterisation of similar systems (Balucani et al. 2009; Leonori et al. 2013; Mancini et al. 2021; Vanuzzo et al. 2022b,a). A first analysis of the PES was performed through density functional theory calculations, with the hybrid functional B3LYP (Becke 1993; Stephens et al. 1994) in conjunction with the correlation consistent valence polarised set aug-cc-pV(T+d)Z (Dunning Jr 1989; Kendall et al. 1992; Woon & Dunning Jr 1993) to locate the relevant stationary points. Harmonic vibrational frequencies were computed at the same level of theory to check on the nature of each stationary point; namely, a minimum if all the frequencies were real or a saddle point if one of the frequencies was imaginary. The assignment of the identified transition states was performed through intrinsic reaction coordinate (IRC) calculations (Gonzalez & Schlegel 1989, 1990). Geometry optimisation and harmonic vibrational frequency calculations were then performed using the more accurate coupled cluster theory, including single and double excitations, as well as a perturbative estimate of connected triples CCSD(T) (Bartlett 1981; Raghavachari et al. 1989; Olsen et al. 1996), with the same basis set aug-cc-pV(T+d)Z. The zero-point energy (ZPE) correction was added for both the B3LYP and the CCSD(T) calculations. Finally, more accurate single-point energy calculations were performed at the CCSD(T) level, corrected with a Density Fitted (DF)MP2 extrapolation to the complete basis set (CBS) and with corrections for core electron excitations. In particular, the energies were computed as follows:
![Mathematical equation: $\[E(\mathrm{CCSD}(\mathrm{T}) / \text {aug-cc-pVTZ })+E(1)+E(2),\]$](/articles/aa/full_html/2025/06/aa54558-25/aa54558-25-eq4.png) (1)
(1)
with
![Mathematical equation: $\[\begin{aligned}& E(1)=E(\mathrm{CCSD}(\text { T,core}) / \text {cc-pVTZ})-E(\mathrm{CCSD}(\mathrm{T}) / \text {cc-pVTZ}), \\& E(2)=E(\text{DF-MP} 2 / \mathrm{CBS})-E(\text{DF-MP} 2 / \text {aug-cc-pVTZ}),\end{aligned}\]$](/articles/aa/full_html/2025/06/aa54558-25/aa54558-25-eq5.png)
and where E(DF-MP2/CBS) is defined as:
![Mathematical equation: $\[\begin{aligned}E(\text{DF-MP} 2 / \mathrm{CBS}) & =E[(\text{DF-MP} 2) / \text { aug-cc-pVQZ })] \\& +0.5772 *[E(\text{DF-MP} 2 / \text { aug-cc-pVQZ }) \\& +-E(\text{DF-MP} 2 / \text { aug-cc-pVTZ })].\end{aligned}\]$](/articles/aa/full_html/2025/06/aa54558-25/aa54558-25-eq6.png) (2)
(2)
The E(DF-MP2/CBS) extrapolation was performed using Martin’s two-parameter scheme (Martin 1996). Since the accuracy of our best-computed value should not be better than the ‘chemical accuracy’ of 1 kcal mol−1, we rounded all the reported energies to 1 kJ mol−1. All calculations have been performed using GAUSSIAN09 (Frisch et al. 2009) and Molpro (Werner et al. 2020), while the analysis of vibrational frequencies was carried out using Avogadro (Hanwell et al. 2012).
2.2 Kinetics calculations
A kinetic characterisation of the two systems was performed by combining capture theory with Rice-Ramsperger-Kassel-Marcus (RRKM) calculations, as done in previous works (Balucani et al. 2009; Skouteris et al. 2019; Marchione et al. 2022; Giani et al. 2023). The initial bimolecular association step was treated using capture theory, assuming an entrance potential V(R) of the form:
![Mathematical equation: $\[V(R)=-\frac{C_m}{R^m},\]$](/articles/aa/full_html/2025/06/aa54558-25/aa54558-25-eq7.png) (3)
(3)
where R is the distance between the Si+ ion and the centre-of-mass of the H2S reactant, Cm is the interaction coefficient between the two species, and m is equal to 4 for ion-neutral processes. When polar molecules are involved, the anisotropic long-range electrostatic ion-permanent dipole (or ion-permanent quadrupole) components (described below and in Sect. 4.3 and 4.4) must be properly taken into account since it can channel the reactants into specific capture angular cones that might be unfavourable to the success of the reaction. Following the same computational approach used in a previous investigation (Marchione et al. 2022), the values of the potential V(R) as a function of the distance between the two interacting particles were evaluated through a semi-empirical model (see last part of Section 2.2 for details), taking into account the long-range attraction between the two reactants.
Once the first adduct was formed, the microcanonical rate coefficient of each subsequent unimolecular process at a fixed total energy, ϵ, was evaluated according to:
![Mathematical equation: $\[K(\epsilon)=\frac{N(\epsilon)}{h \rho(\epsilon)},\]$](/articles/aa/full_html/2025/06/aa54558-25/aa54558-25-eq8.png) (4)
(4)
where N(ϵ) represents the number of states open at the transition state at an energy ϵ, ρ(ϵ) represents the reactant density of states at the same energy, and h is Planck’s constant. Finally, when no clear transition state is present, variational transition state theory (Klippenstein 1992) was used. More in detail, the results of a series of ab initio calculations, performed along the reaction coordinate, were introduced in the RRKM analysis, and the transition state was chosen as the point yielding the lowest value of the rate constant. Subsequently, a Markov (stochastic) matrix was set, including the results of the unimolecular calculations for all reaction pathways, as done in previous work (Balucani et al. 2009, 2012; Vanuzzo et al. 2022b; Balucani et al. 2023). The matrix was subsequently raised to a high enough power to achieve convergence, allowing us to derive the branching ratios and rate constants for all product channels in the desired temperature range.
Once the rate constant for each reaction channel was obtained as a function of temperature, we derived the α, β and γ parameters used to express k(T) in astrochemical models according to:
![Mathematical equation: $\[k(T)=\alpha\left(\frac{T}{300}\right)^\beta \exp ^{-\frac{\gamma}{T}}.\]$](/articles/aa/full_html/2025/06/aa54558-25/aa54558-25-eq9.png) (5)
(5)
The global long-range non-covalent intermolecular potential, V(R), controlling the reaction at each separation distance, R, is defined as a combination of an electrostatic term, Velec, and a non-electrostatic term, Vnelec:
![Mathematical equation: $\[V(R)=V_{elec}(R)+V_{nelec}(R).\]$](/articles/aa/full_html/2025/06/aa54558-25/aa54558-25-eq10.png) (6)
(6)
Here, Velec(R) can be assumed to play a minor role when, due to a small interaction anisotropy, all relative configurations contribute and the repulsive and attractive parts of Velec(R) are balanced. This approximation was preliminarily applied to the Si+ plus H2S system, considering the low value of the H2S permanent electric dipole moment μ=0.977 D (Viswanathan & Dyke 1984; Russell 2022). However, such a treatment is valid only if the reaction is considered to occur at thermal and hyper-thermal energies. For the low temperature range, the model must be extended, as described in Sect. 4.4.
To evaluate the efficiency of capture, only the role of a radial dependent Vnelec(R) ought to be taken into account. The formulation of Vnelec(R), which represents a balance between size repulsion with induction and dispersion attractions, is done using an Improved Lennard-Jones (ILJ) function (Pirani et al. 2008) formulated as:
![Mathematical equation: $\[V_{nelec}(R)=V_{I L J}(R)=\varepsilon_p\left[\frac{4}{n(R)-4}\left(\frac{R_m}{R}\right)^{n(R)}-\frac{n(R)}{n(R)-4}\left(\frac{R_m}{R}\right)^4\right],\]$](/articles/aa/full_html/2025/06/aa54558-25/aa54558-25-eq11.png) (7)
(7)
where ϵp and Rm are, respectively, the depth and location of the average potential well, R is the already defined centre-of-mass separation distance, and the term n(R) is dependent on the distance R, defined as:
![Mathematical equation: $\[n(R)=\beta_p+4\left(\frac{R}{R_m}\right)^2.\]$](/articles/aa/full_html/2025/06/aa54558-25/aa54558-25-eq12.png) (8)
(8)
The parameter βp is related to the hardness of the two interacting fragments and was set equal to 7.0, while ϵp and Rm depend on the charge and polarizability of the two interacting partners. The relevant value for the long-range attraction coefficient C4 can be extracted from the asymptotic behaviour of the attractive (negative) term in Eq. (7), which is exploiting the relation: ![Mathematical equation: $\[C_{4}=\varepsilon_{p} \cdot R_{m}^{4}\]$](/articles/aa/full_html/2025/06/aa54558-25/aa54558-25-eq13.png) . Considering the charge of Si+ (q = +1) and the isotropic polarizability values of 2.82 and 3.71 Å3 for Si+ (as resulting from the B3LYP/aug-cc-pV(T+d)Z calculations performed ad hoc) and H2S (Olney et al. 1997; Russell 2022), respectively, and applying the method described in Falcinelli et al. (2023) and references therein, we evaluated ϵp = 147 meV, Rm=3.83 Å, and C4=3.15·104 meV·Å4. A correct evaluation of C4 is of utmost importance for calculating the capture probability.
. Considering the charge of Si+ (q = +1) and the isotropic polarizability values of 2.82 and 3.71 Å3 for Si+ (as resulting from the B3LYP/aug-cc-pV(T+d)Z calculations performed ad hoc) and H2S (Olney et al. 1997; Russell 2022), respectively, and applying the method described in Falcinelli et al. (2023) and references therein, we evaluated ϵp = 147 meV, Rm=3.83 Å, and C4=3.15·104 meV·Å4. A correct evaluation of C4 is of utmost importance for calculating the capture probability.
3 Experimental methods
3.1 Generation of the ion beam
In terms of absolute CSs and BRs, data for the Si+ plus H2S reaction were collected using the Gas-phase Experiment for Measurements on Ion-Neutral Interactions (GEMINI) set-up at the University of Trento (Ascenzi et al. 2007; Franceschi et al. 2007; Richardson et al. 2022; Mancini et al. 2024). The GEMINI set-up is a tandem mass spectrometer composed of two octopoles (O) and two quadrupole mass filters (Q) in a O-Q-O-Q configuration that allows for the investigation of bimolecular reactions of mass-selected ions. Data as a function of the collision energy (ECM) were derived by measuring the yields of both parent and product ions; Si+ ions were produced by electron ionisation of a mixture of SiCl4 and D2 (in a concentration of 10% and 90%, respectively) at electron energies in the range of 55–60 eV. Electrons were emitted by a tungsten filament with the emission current stabilised by an electronic feedback mechanism. The gas mixture is introduced into the ion source by a variable leak valve (Agilent Technologies/Varian model 951-5106) in the 10−6−10−4 mbar pressure range. The gas chosen for the dilution of SiCl4 is D2, even though the best fragmentation to Si+ is given by a mixture with Ar. This choice is based on the need to ensure that the reaction is carried out with the reactant ions in the electronic ground state, which in the case of Si+ is the doublet state, 2P. About 5.3 eV above, the Si+ ion has a metastable first excited state (4P), with lifetimes spanning from 104 to 811 μs according to the J sublevels (Calamai et al. 1993). The presence of D2 in the mixture effectively helps to scavenge such electronic excited states. In fact, as reported by Wlodek et al. (1987); Wlodek & Bohme (1989), the Si+ + D2 → SiD+ + D reaction is endothermic by about 1.2 eV for Si+(2P) and exothermic for the 4P excited state; for this reaction, the same authors give a constant rate value equal to (7.7 ± 2.3)×10−10 cm3 s−1 at T = 293 ± 2 K. The amount of excited state of Si+ has been estimated by measuring the attenuation of the parent ion beam and the SiD+ product as a function of the D2 pressure in the first octopole at a fixed ECM. In this way, a ≃ 10% of residual Si+(4P) in the ion beam has been found. Following the ionisation and dissociation of the precursor, ions pass through the first octopole, which acts as an ion guide, before being mass selected by the first quadrupole. Reactions occur in the second octopole, which is surrounded by a 10 cm long scattering cell. The pressure of the neutral gas in the scattering cell surrounding the second octopole is monitored by a spinning rotor gauge (SRG2 MKS Instruments, MA. USA).
3.2 Determination of absolute cross sections as a function of the collision energy
The experimental total reactive CS σtot, at fixed collision energy, is determined by the relation:
![Mathematical equation: $\[\sum I_P=I_0\left(1-\exp \left(-\sigma_{t o t} n_g l\right)\right),\]$](/articles/aa/full_html/2025/06/aa54558-25/aa54558-25-eq14.png) (9)
(9)
where IP, and I0 are the measured transmitted intensities of the product and reactant ions, respectively, ng is the gas density of the reaction partner in the scattering cell and l is the effective path length. CSs for the individual product channels, σP, were obtained using the equation:
![Mathematical equation: $\[\sigma_P=\sigma_{t o t} \cdot\left(I_P / \sum I_P\right).\]$](/articles/aa/full_html/2025/06/aa54558-25/aa54558-25-eq15.png) (10)
(10)
For low gas densities (i.e. pressures), Eq. (9) is reduced to the thin target limit:
![Mathematical equation: $\[\sum I_P / I_0=\sigma_{t o t} n_g l.\]$](/articles/aa/full_html/2025/06/aa54558-25/aa54558-25-eq16.png) (11)
(11)
Thus, at low pressures the slope of the intensity ratio, IP/I0, versus the gas density yields the product CS. Knowing the effective path length (i.e. effective cell length) is pivotal for the conversion from relative to absolute CS. Thus, calibration experiments have been performed on the Ar.+ + D2 system, which is the subject of previous studies using a similar set-up (Ervin & Armentrout 1985). Further details are reported in Appendix A. In this way, an effective cell length value of 11.4 ± 4.0 cm was obtained, with the magnitude of the uncertainty resulting from a combination of the uncertainties in the literature CSs used in the calibration and in our measurement procedure. To carry out the CS measurements, the cell was filled with H2S (synthesised in our laboratory as described in Appendix B and purified through several freeze-thaw cycles) at variable pressures in the range of 10−7 to 10−4 mbar, corresponding to a molecular density ranging from 1010 to 1012 molecules cm−3. The chosen pressure interval further helps to limit the impact of secondary reactions, while still providing an accurate pressure measurement and a dynamic range of 10−1 to 102 Å2 for absolute CSs. Data were acquired over two months, with an uncertainty of ~30%. The collision energy in the laboratory frame is dependent on both the reagent ion charge (+1 in the case of this work) and the difference between the ion source and reaction cell potentials. The retarding potential method was applied to the reagent ion beam (Teloy & Gerlich 1974) to determine the maximum of the first derivative of the reagent ion yield, which defines the zero of the kinetic energy, as shown in Fig. 1. In this way, we have estimated an average reagent ion beam full width half maximum (FWHM) of ~0.35 eV in the centre-of-mass (CM) frame. By varying the voltages of the second octopole and all subsequent optics, we are able to scan a collision energy range from about 0.1 to 10 eV in the CM frame (ECM). The conversion from laboratory to CM frame is performed through the usual equation:
![Mathematical equation: $\[E_{C M}=E_{l a b} \cdot \frac{m}{M+m},\]$](/articles/aa/full_html/2025/06/aa54558-25/aa54558-25-eq17.png) (12)
where Elab is the collision energy in the laboratory frame, while m, and M are the masses of the neutral target and the parent ion, respectively.
(12)
where Elab is the collision energy in the laboratory frame, while m, and M are the masses of the neutral target and the parent ion, respectively.
 |
Fig. 1 Typical normalized trend for the parent ion (blue squares) as a function of the octopole DC voltage. In this case, the red dotted trend represents the first derivative of the experimental points, while the black solid curve, with FWHM ~1.15 V in the laboratory frame, gives the best fit of the red data points. |
Reaction enthalpies (ΔH) for the products of the reaction of Si+ with H2S from the literature and our calculations.
4 Results
4.1 Experimental reactive cross sections and branching ratios
After collecting mass spectra at different gas pressures of H2S, the observed product ions from Si+ reacting with H2S have been identified at m/z 60 (SiS+) and 61 (SiSH+/HSiS+). An additional signal has been found at m/z 35 and identified as the product of the secondary reaction of the m/z 61 ion with H2S, forming H3S+. Although this last product could not be completely removed, its intensity has been reduced as much as possible by injecting a highly diluted H2S / He mixture into the reaction cell (in a concentration of about 1.5% of H2S). According to Fox et al. (1989), the formation of H3S+ due to the reaction of SiSH+ with H2S is a fast process, with a rate of k = 2.9 × 10⁻¹⁰ cm3 s−1. The m/z 61 ion yield was then corrected by considering the amount of m/z 35.
The reaction of Si+ with H2S was studied previously using the Selected Ion Flow Drift Tube (SIFDT) technique, with a reported rate constant for the m/z 61 product channel of 6.8 × 10⁻¹⁰ cm3 s−1 molecule−1 at a temperature of 298 K (Glosík et al. 1995). However, the formation of the m/z 60 product (SiS+) was not reported in that study. In our experiment, the largely dominant product is the one at m/z 61, associated with the SiSH+ ion, while the m/z 60 ion (SiS+) represents a minor channel. An additional contribution to the m/z 61 signal from the HSiS+ isomer (a reaction pathway that is endothermic by +10 kJ mol−1, according to our calculations; see Sect. 4.2) cannot be ruled out, considering the energy spread of the parent ion beam and the uncertainty intrinsic in the calculations. A summary of the possible reaction pathways is reported in Table 1.
The absolute reactive CSs for the different channels have been retrieved by acquiring several measurements of product ion intensities, SiS+ and SiSH+/HSiS+, against the H2S pressure in the collision cell at 0.1 eV in the CM frame (see Appendix C). The CS trends for the product channels have been recorded as a function of ECM and the results are shown in Fig. 2, where the data for the m/z 61 ion (black squares in the figure) include the correction for the contribution from the secondary reaction product. For both products, we observe a decrease in CS with increasing ECM (with values in the range from 0.05 to 40 Å2), with a difference in the shape of the trend that could be attributed to a difference in the mechanistic aspects of the formation pathways (see the discussion in Section 4.2).
To experimentally observe the contribution of the electronically excited state of Si+ to the total CS, the reaction has also been investigated using a mixture of SiCl4/Ar to generate Si ions, instead of the SiCl4/D2 mixture. In this way, an ion beam containing approximately 60% of Si+ in the excited 4P state can be produced, with the amount of excited state in the beam determined with the procedure described in the discussion on experimental methods in Sect. 3.1. Despite the fact that a significant change was expected in terms of reactivity (i.e. CS), the difference in the total CS estimated at the same ECM (e.g. 0.1 eV) remains within the error bars. In fact, the obtained total absolute CS is 26.8 ± 7.9 Å2 for the reaction involving ~60% of Si+ in its excited state, against a value of 39.4 ± 10.3 Å2 for the reaction having just 10% of Si+ in the 4P state. The smaller total CS with the increase of concentration of Si+(4P) is a consequence of its smaller reactivity with respect to the reaction involving the ground 2P state. This can, in turn, be rationalised when considering the spin multiplicity in the case of the reactions of the ground and excited states. In particular, while the reaction involving Si+(2P) proceeds adiabatically throughout a doublet PES (see Section 4.2), the Si+(4P) reaction needs to switch from the initial quartet to the doublet state, thus becoming spin-forbidden and requiring inter-system crossing to occur.
The determined experimental BRs are (95 ± 2)% for the main product, and SiSH+/HSiS+ and (5 ± 1)% for SiS+. The total CS as a function of ECM, obtained by summing up over the two channels, is reported in Fig. 3 as black diamonds. A detailed discussion of the other results shown in the figure is given in Sect. 4.4.
 |
Fig. 2 Experimental cross-section (CS) for the reaction channels as a function of the collision energy ECM. The black solid squares are the absolute CSs for the main channel at m/z 61 (SiSH+/HSiS+), while the blue up-pointing triangles refer to the SiS+ product, at m/z 60. |
 |
Fig. 3 Total CSs for the reaction of Si+ with H2S as a function of collision energy ECM. The black filled diamonds are the experimental data, the blue filled triangles and the red open diamonds are the CSs as estimated from simple capture models, (i.e. Langevin’s and the average dipole orientation model, respectively). The red and green dashed curves are from our fitted model to extract the true CS from the experimental data: the red curve represents the fitting function, obtained by modelling the effective CS, as in Eq. (14); while the green dashed line represents the form of the true CS extracted as a result of the fitting procedure. Further details are discussed in Sect. 4.4. |
4.2 Electronic structure calculations of the reaction potential energy surface
The global doublet PES obtained for the Si+(2P)+H2S(1A1) reaction is reported in Fig. 4. For simplicity, only the more accurate results (i.e. the CCSD(T)/CBS//CCSD(T)/aug-cc-pV(T+d)Z results) are shown, while the data obtained at the different levels of theory are reported in Appendix D.
The PES results in Fig. 4 suggest that the first step of the reaction is represented by the barrier-less addition of the Si+ cation to the sulphur atom of the H2S molecule. This leads to the formation of the MIN1 intermediate, which is characterised by the presence of a new Si-S σ-bond (bond length = 2.375 Å) perpendicular to the H2S molecular plane. MIN1 (more stable than the reactants by 175 kJ mol−1) can directly undergo a S-H bond fission, giving rise to the products 1SiSH+ + H (the superscripts on the left side indicate the multiplicity of the state) in a barrier-less exit channel that is exothermic by −50 kJ mol−1 with respect to the reactants. In addition, MIN1 can undergo an H2-elimination accompanied by the production of 2SiS+ (the enthalpy of reaction for this channel is −85 kJ mol−1 at our best level of theory). This channel proceeds through a very high barrier of 163 kJ mol−1 (TS4), which is typical for a three-centre H2 elimination channel. However, TS4 is submerged, based on its location at −12 kJ mol−1 with respect to the reactant energy asymptote. Finally, MIN1 can also isomerise to MIN2 via H-migration by overcoming a barrier of 73 kJ mol−1 (TS1 located at −102 kJ mol−1). MIN2 (located at −213 kJ mol−1) can directly undergo a Si–H bond fission, forming the 1SiSH+ cation, in a barrier-less process. Additionally, a four-centre H2 elimination can take place, overcoming a barrier (TS5) of 133 kJ mol−1. The rotation of MIN2 around the Si-S axes, via a small barrier of 35 kJ mol−1 (TS2), leads to the formation of the MIN3 intermediate (−222 kJ mol−1). Once formed, MIN3 can undergo: 1) a Si–H bond fission leading to 1SiSH+ in a barrier-less channel; or 2) an S–H bond fission leading to the 1HSiS+ isomer in a slightly endothermic channel (+10 kJ mol−1). Therefore, its contribution is expected to be negligible under the low-temperature conditions of the interstellar medium; finally, MIN3 can also 3) isomerise to MIN4 (−213 kJ mol−1) via an additional H-atom transfer by overcoming a barrier of 126 kJ mol−1 (TS3). MIN4 can only evolve to the 1SiSH++H products by the barrier-less fission of one of the two Si–H bonds. The geometry of all the stationary points, together with the cartesian coordinates and harmonic vibrational frequencies, are reported in Appendix E.
 |
Fig. 4 Schematic representation of the PES obtained for the Si+(2P)+H2S (1A1) reaction with energies (in kJ mol−1) evaluated at the CCSD(T)/CBS//CCSD(T)/aug-cc-pV(T+d)Z level of theory. Data obtained at the CCSD(T)/aug-cc-pV(T+d)Z level of theory are reported (in blue) in parenthesis. |
4.3 Stereodynamic considerations
Some selectivities are expected to arise from the electronic configuration of reagents and from the strength, range, and anisotropy of the long-range interaction components driving the reactants toward the formation of the reaction precursor state. In particular, in its ground electronic state Si+(2P) is an open-shell species with a half-filled 3p orbital and two empty 3p orbitals capable of accepting an electronic charge from the other reagent, giving rise to a weak chemical bond. On the other hand, H2S is a polar molecule with an electric dipole moment of μ = 0.977 D and an appreciable quadrupole moment, indicating an anisotropic distribution of its outer electronic charge. The electronic configuration, determining most of the properties of H2S, consists of: two σ chemical bonds, formed by the 1 s orbitals of each H atom with each of the half-filled 3p orbitals (3px and 3pz) of the S atom; a lone pair occupying the 3pz orbital, aligned perpendicularly to the molecular plane; and another lone pair in an orbital lying in the molecular plane, aligned along the C2 axis and with most of the density on the opposite side of the H bonds. This representation is reported in Fig. 1 of Falcinelli et al. (2016). In the same paper, the authors performed kinetic energy measurements of emitted electrons in photo-ionisation and Penning ionisation experiments, demonstrating that the HOMO orbital of H2S has a 3pz character. Starting from H2S in its ground electronic state, the removal of an electron from the lone pair lying in the molecular plane, leading to the formation of the first excited electronic state of H2S+, requires an energy of ~3 eV (~290 kJ mol−1). This additional information suggests that any reaction of H2S, as the present one evolving along the ground electronic state PES, is triggered by the involvement of the 3pz lone pair (consistent with the geometry of the adduct indicated as MIN1 in Fig. 4) that is accompanied by a stereoselective constraint on the reactivity. This implies that the reaction occurs within a limited range of suitable angles, distributed around the axis perpendicular to the plane in which H2S lies. The stereodynamics of H2S Penning ionisation reaction with Ne* as reported in Falcinelli et al. (2016), suggests an opening of the effective relative angular cone, controlling the acceptance of reactants, of about 20% with respect to the global approach on the sphere. By using the same approach for the Si+ + H2S reaction, we can reduce the capture CS and rate coefficient, evaluated from the spherically averaged attraction coefficient, by about 80%.
4.4 From experimental CSs to rate constants
In Fig. 3, the experimental CSs are compared with predictions from standard capture models (Tsikritea et al. 2022), such as the Langevin one describing the interaction between a point-charge ion and a polarizable but non-polar neutral (red open diamonds) and the Average Dipole Orientation (ADO) model (Bass et al. 1975; Su et al. 1978) (blue line). The latter considers the average orientation of the dipole of the neutral species with respect to the ion, by introducing a scaling parameter, c, that can be estimated from the values of the dipole moment and polarizability of the molecular reaction partner (a value of c = 0.145 is used for the present system). Notably, neither model reproduces the absolute values and the trends of the experimental CSs as a function of collision energy. This comparison suggests that the stereodynamical effects (Sect. 4.3), which cannot be accounted for in capture models, may play a role in the reaction.
When extracting CSs from guided ion beam experiments, it is important to consider the effect of the experimental ion energy distributions, since these can obscure some features of the true CSs, especially at low collision energies (Ervin & Armentrout 1985). In our experiments, the Si+ beam has a width (FWHM) of 0.35 eV in the CM frame and the temperature of the gas in the scattering cell can be assumed T ≈ 305 K (due to RF heating inside the octopole ion guide). In this case, we have FWHM ≫ kBT, which means that the Doppler broadening contribution (due to the random thermal motion of the reactant molecules in the scattering cell) to the overall energy spread of the beam is negligible. Under this condition, the energy distribution f(E, ECM) of the ion beam is given by
![Mathematical equation: $\[f\left(E, E_{C M}\right)=\frac{1}{\sqrt{2 \cdot \delta \cdot \pi}} \exp \frac{-\left(E-E_{C M}\right)^2}{2 \cdot \delta^2},\]$](/articles/aa/full_html/2025/06/aa54558-25/aa54558-25-eq18.png) (13)
(13)
where E is the actual relative collision energy, δ is the standard deviation of the distribution (i.e. FWHM ≈ 2.355δ; in this work, δ = 0.15), and ECM is the nominal CM collision energy. As a result of the ion energy distribution, the phenomenological CS as a function of the ion energy (hereafter denoted as effective CS, σe f f(ECM)) differs from the true CS as a function of the relative collision energy; here denoted as σ(E). The form of the convolution of σ(E) that takes into account the ion energy distribution while neglecting the Doppler broadening has been adapted from Chantry (1971); Ervin & Armentrout (1985); Tosi et al. (1994) and can be expressed as:
![Mathematical equation: $\[\sigma_{e f f}\left(E_{C M}\right)=\int_0^{\infty} \sigma(E) f\left(E, E_{C M}\right) d E.\]$](/articles/aa/full_html/2025/06/aa54558-25/aa54558-25-eq19.png) (14)
(14)
Since the direct deconvolution of σe f f(ECM) does not result in a unique form for σ(E), the functional form of the true CS needs to be inferred. To this purpose, σ(E) has been modelled following the work of Ervin & Armentrout (1985) and modifying it by using a Fermi-Dirac function to reproduce the experimental trend at high collision energies:
![Mathematical equation: $\[\sigma(E)=\sigma_0 \cdot \frac{\left(E-E_T\right)^n}{E} \cdot \frac{1}{1+\exp \left(\frac{E-E^{\prime}}{E^{\prime \prime}}\right)}.\]$](/articles/aa/full_html/2025/06/aa54558-25/aa54558-25-eq20.png) (15)
(15)
Here, σ0 is an energy-independent scaling factor, ET is a threshold energy factor, n is the parameter controlling the power-like part of the function, and E′, E″ are parameters that allow for an improved adjustment of the fitting function in the high-collision energy range. Such a function is represented in Fig. 3 as the red curve, where the guess for the true CS function is also reported (green dashed curve) together with the experimental total CSs (black diamonds). According to the proposed model for the true CS (and in agreement with the experimental observation), the CS sharply decreases and eventually falls below our detection sensitivity at high ECM values. This behaviour is attributed to the shortening of the collision time as ECM increases, making the electronic rearrangement not fast enough for the reaction to proceed. Conversely, as ECM decreases, the system tends to access more stable, though less reactive, configurations. In the modelled CS, this effect is incorporated by introducing a threshold energy, ET, whose value depends on the relative orientation of the Si+ ion with respect to H2S. As shown in Fig. 5, the barrier (ET) is estimated by considering only the electrostatic component, which accounts for the majority of the long-range interaction anisotropy. Although the reaction pathways leading to the products are exothermic and barrier-less, the ET term represents an effective energy threshold for the reaction to occur, intrinsically dictated by the stereodynamics of the process. As suggested by the PES in Fig. 4, the obtained reaction product is subdued to the evolution of the MIN1 intermediate, whose formation probability depends on the geometry of the precursor complex formed by collisions between the Si+ ion and H2S. When the ion collides perpendicularly (θ = 90°) or at a non-zero angle with respect to the C2 principal axis (Fig. 6), the formation of the intermediate is favoured. in contrast, non-reactive collisions occur when the ion approaches along the major C2 axis of H2S (θ = 0°). As the collision angle varies from 0° to 180°, the magnitude of ET increases due to the repulsive contributions from the hydrogen atoms lying in the molecular plane. Therefore, ET represents the energy barrier that must be overcome to enable the transition of the precursor complex from its most stable, non-reactive configuration (θ = 0°) to the activated complex, where significant orbital overlap occurs between the atomic orbital of Si+ and the HOMO of H2S, which is aligned perpendicularly to the molecular plane (see Fig. 6).
After extrapolating the true CS, the conversion to rate constant k as a function of temperature T can be done by averaging the true CS on the Maxwell-Boltzmann distribution, so that
![Mathematical equation: $\[k(T)=\left(\frac{1}{\pi \mu}\right)^{1 / 2}\left(\frac{2}{k_B T}\right)^{3 / 2} \int_0^{\infty} \sigma(E) \cdot E \cdot \exp \left(-E / k_B T\right) d E.\]$](/articles/aa/full_html/2025/06/aa54558-25/aa54558-25-eq21.png) (16)
(16)
Using this approach and adjusting the fitting function, we obtained the best fit for threshold energy (ET) values spanning 2 to 20 meV and rate constant value ranging from k = 6.7 × 10⁻¹⁰ to 4.1 × 10⁻¹⁰ cm3 s−1 molecule−1 at 300 K, which is in excellent agreement with the experimental value reported by Glosík et al. (1995). Reasonable fitting results were obtained for ET = 2 meV with parameters σ0 = 23.8 Å2, n = 0.51, E′ = 3.6 eV, and E″ = 1.6 eV. For different ET values, the optimisation of the fitting function can be easily achieved by slightly readjusting these parameters. However, when ET exceeds approximately 20 meV, a rapid decrease in the estimated rate constant is observed. This behaviour allows us to propose such a value as an upper limit for the threshold energy.
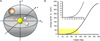 |
Fig. 5 a) Schematic representation of the Si+−H2S reactive system. The H2S molecule is bound within the xz plane, while the Si+ ion moves within the yz plane, at a fixed distance from the molecule (i.e. the equilibrium Si-S bond length R = 3.8 Å) and with an angle, θ, with respect to the xz plane. As the ion moves, it probes the electrostatic potential from z = −R to z = +R. b) Energy barrier (ET) as a function of θ: the electrostatic potential increases as the ion moves from θ = 0° to 180° in the yz plane, with an increase of the repulsive contribution given by the hydrogen atoms. The barrier is obtained as a difference between the effective potential calculated at θ = θ′ and θ = 0°. The inset is an expansion of the yellow area in the main graph. |
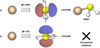 |
Fig. 6 Schematic representation of the stereo-dynamical effect of the collision between the two reaction partners, Si+ and H2S, in two limiting cases: a) for an approach at θ = 90° (i.e. perpendicular to the principal C2 axis), the ion probes the interaction with the HOMO orbital of the H2S molecule, favouring the formation of the MIN1 intermediate; b) as the ion approaches along the nodal plane (θ = 0°), no orbital overlap exists, thus leading to a non-reactive collision. |
4.5 RRKM product branching ratios and rate constants
The RRKM calculations were performed for a range of temperatures, spanning from 10 to 300 K. Within this temperature range, the largely dominant channel is the one leading to 1SiSH+ + H, with a BR of approximately 98%. The SiS+ + H2 channel accounts only for the 1.5% of the total reactive flux. These results are in line with the PES characteristics shown in Fig. 4: once formed, MIN1 can either dissociate into H + SiSH+ in a barrierless channel or undergo a three-centre H2 elimination, a process that is associated with a large barrier of 163 kJ mol−1. Isomerisation to MIN2 is characterised by a smaller barrier of 73 kJ mol−1. The values of the unimolecular rate constants as a function of energy (ϵ) for the various steps are reported in Fig. 7. The unimolecular rate constant for the MIN1 → MIN2 isomerisation process (equal to 2.7 × 10¹² s−1), together with the direct decomposition of MIN1 leading to SiSH+ + H (which shows a rate constant of 1.4 × 10¹² s−1), appear to be several orders of magnitude higher than the rate constant associated with the H2 forming channel (equal to 1.9 × 10⁹ s−1). Such a difference in the rate constants, together with the fate of MIN2, determines the predominance of the H-displacement process over the H2 formation channel. Moreover, as mentioned in Sect. 4.3, the acceptance angular cone of the reactants has been taken into account by reducing the calculated CS by approximately 80%, allowing us to reproduce the experimental rate constant value measured at 300 K. The main result is that the total rate constants are largely independent from temperature, due to the intrinsic nature of the method that combines the assumption of ion-molecule capture (see the next section) with RRKM theory.
The BRs derived from the present RRKM investigation were calculated for the two exothermic channels and are almost insensitive to temperature changes within the 10–300 K range. As the temperature increases, a minor increase is noticeable in the BRs of the H2 + 2SiS+ products, whose contribution may become non-trivial at higher temperatures. The derived BR values, along with the calculated rate constant at three different temperatures, are reported in Table 2. A possible explanation for the discrepancy between the BRs obtained from the calculations and the experiments (where a BR=(5 ± 1)% was found for the SiS++H2 channel) could lie in the uncertainty intrinsic to the energetics calculations (particularly for TS4 and TS5). These uncertainties may significantly affect the unimolecular rate constants for the pathways MIN1 → SiS++H2 and MIN2 → SiS++H2. In fact, considering an uncertainty of 5 kJ mol−1 in the barrier associated with TS5, a slight increase (around 0.7%) in the BR for the H2-forming channel was observed. Therefore, accounting for the uncertainty in the electronic structure calculations improves the agreement between theoretical predictions and experimental results.
4.6 Comparison with rate constants from capture models
By comparing the rate constants k(T) obtained with our estimate from experimental CSs (Sect. 4.4) and from RRKM calculations (Sect. 4.5) with the range of available standard capture models (Su & Chesnavich 1982; Kosmas 1984), we observed a mismatch both in the trend and the rate constant values, as reported in Fig. 8. The predictions according to the capture models indeed diverge as the temperature approaches 10 K, due to the absence of an energy threshold.
All the capture models presented here involve the role of the permanent electric dipole of H2S and demonstrate an increase in the rate coefficient as the temperature decreases (with the exception of Langevin’s model, which does not include a dependence on T). This can be ascribed to the enhanced capture efficiency due to the contribution of the ion-permanent dipole attraction at lower temperatures. In fact, capture models assume that the most effective configuration for reactivity involves the positive atomic ion approaching along the direction of the electric dipole moment of the neutral partner. For H2S, the dipole moment vector lies in its molecular plane and is aligned along the C2 axis. However, based on the electronic symmetry considerations discussed in Sect. 4.2, while the presence of an electric dipole moment may increase the capture CS, the resulting precursor state (where Si+ approaches H2S along its axis from the sulphur side) cannot evolve towards the transition state of the reaction, as it possesses a different symmetry. Consequently, reactivity along the ground PES is hindered by a decrease in temperature, which contrasts with the predictions of standard capture models and of the RRKM calculation. We therefore suggest using the total rate constant estimated from the experimental CSs, for which values of the α, β, and γ coefficients, following the KIDA database formalism of Eq. (5), are given in Table 3. Due to the characteristic trend of the rate constant, a satisfactory fit is best obtained by separating results into two temperature ranges: 10–30 K and 31–300 K. For the BRs among the two product channels, our experimental and theoretical results allow us to define a lower and upper limit, as reported in the lower part of Table 3.
Rate coefficients k(T) and branching ratios (BR) for the Si+(2P)+H2S(1A1) reaction at different temperatures (T) from RRKM calculations.
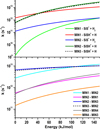 |
Fig. 7 Unimolecular rate constants for the exothermic channels as a function of energy (ϵ). Top panel: processes leading to products via decomposition from the various intermediates. Bottom panel: processes leading to the interconversion of intermediates. |
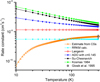 |
Fig. 8 Total rate constants, k, as a function of temperature, T, for the reaction Si+ with H2S estimated using various capture models and our results. Extrapolated rates from our experimental CSs (with ET=2 meV; see Sect. 4.4) are shown as orange open triangles, while RRKM calculations (see Sect. 4.5) are shown as cyan filled stars. The other trends are: red open diamonds showing the Langevin model; blue solid triangles showing the scaled averaged dipole orientation (ADO) model with a c value of 0.145; black solid circles showing the Su and Chesnavich model derived from an empirical fit of variational transition state theory and classical trajectory calculations for point charged ions and polar neutrals (Su & Chesnavich 1982); green solid squares showing the average cosθ method (Kosmas 1984); black open circle showing the measured datapoint by Glosík et al. (1995), with the relative ±30% error bar. |
Total rate constant coefficients (α, β, and γ) and BRs for the reaction Si+(2P) + H2S(1A1).
4.7 The SiSH+ (1A1) + NH3 (1A1) reaction
The formation of SiS in the ISM through the reaction between SiSH+ and NH3 is a possible alternative to electron recombination of protonated SiS, a process already considered in the available databases to covert protonated SiS into the observed neutral species (Wakelam et al. 2024; Wakelam et al. 2015; Millar et al. 2024). Adopting the same approach as above (see last part of Sect. 2.2), the resulting long-range attraction coefficient C4= is 22.3 eV·Å4. This value is lower than that for the Si+ + H2S reaction because of the lower polarizability of NH3 (2.16 Å3) compared to H2S (3.71 Å3). Conversely, the role of the electrostatic contribution, arising from charge-electric dipole interaction, is larger for NH3 (the dipole is 1.47 D to be compared with 0.977 D for H2S). For the SiSH+ + NH3 reaction, the estimated C4e f f includes the contribution of the anisotropic ion-permanent dipole. The overall C4e f f coefficient value is 125.2 eV Å4 when considering the most attractive configuration, which is the one with the SiSH+ ion approaching the NH3 molecule with its protonated site pointing towards the nitrogen atom. Among all the possible configurations, this is by far the most relevant.
A schematic representation of the PES for the reaction of SiSH+ (1A1) with NH3 (1A1) is reported in Fig. 9, while the optimised geometries of intermediates and products are given in Appendix E. The reaction is exothermic by 147 kJ mol−1 at the CCSD(T)/CBS level of theory (143 kJ mol−1 at the CCSD(T)/aug-cc-pV(T+d)Z level). The process is characterised by the barrierless formation of an intermediate (MIN5), which is stabilised by 203 kJ mol−1 (200 kJ mol−1, at the CCSD(T)/aug-cc-pV(T+d)Z level) relative to the reactants. We note that no van der Waals complexes have been identified in the entrance channel. The ammonia molecule interacts with the H atom of the molecular ion in a geometrical configuration similar to the one leading to the formation of neutral SiS by proton transfer. In most of the other configurations, the electrostatic ion-permanent dipole term changes in value and sign, often resulting in a repulsive contribution that hinders the approach of the reactants. The subsequent dissociation of MIN5 into SiS and NH4+ is a barrierless process. Since the intermediate can directly isomerise to form the products with no barrier, the back dissociation is negligible. As a result, the rate coefficient was found to be equal to 2.7 × 10⁻⁹ cm3 s−1 and independent on temperature.
The rate constant value so obtained is very close to the 2.7 × 10⁻⁹ cm3 value derived from the combined variational transitionstate theory-classical trajectory study (Su & Chesnavich 1982; Fox et al. 1989). However it is about a factor three larger than the experimental value of 9.7 ± 2.9 × 10⁻¹⁰ cm3 measured at 295±2 K (Fox et al. 1989). Based on such value, in the UMIST database1 (Millar et al. 2024) the reaction is reported with coefficients α = 9.7 × 10⁻¹⁰ cm3 s−1, β=−0.5, and γ=0. In the absence of additional information on the stereoselectivity involved in this reaction and considering that the RRKM capture model tend to overestimate the rate coefficient, we propose to assume a rate constant independent of temperature. This is demonstrated in our calculations, scaled on the experimental value at 295 K. Hence, we suggest revising the UMIST values to α = 9.7 × 10⁻¹⁰ cm3 s−1, β=0, and γ=0.
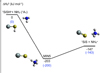 |
Fig. 9 Schematic representation of the potential energy surface obtained for the SiSH+(1A1)+NH3(1A1) reaction with energies (in kJ mol−1) evaluated at the CCSD(T)/CBS//CCSD(T)/aug-cc-pV(T+d)Z level of theory. Data obtained at the CCSD(T)/aug-cc-pV(T+d)Z level of theory are reported (in blue) within the parenthesis. |
5 Discussion and astrophysical implications
5.1 Formation of SiS from Si+ followed by the proton transfer to NH3
Absolute CSs and BRs for the reaction of Si+(2P) with hydrogen sulphide (H2S) have been measured as a function of the collision energy in the range between 0.1–10 eV. The Si+ ions have been generated via electron impact ionisation (EI) of SiCl4. Two signals were identified at m/z 61 and 60 to be assigned to SiSH+/HSiS+ and SiS+, with branching ratios of (95 ± 2)% and (5 ± 1)%, respectively. From a comparison between the experimental CSs and those derived by simple capture models, a strong mismatch was observed in both trends and magnitudes, suggesting that such models are not suitable to describe the investigated reaction. Experimental data has been combined with theoretical calculations of stationary points and transition states (at the CCSD(T)/CBS//CCSD(T)/aug-cc-pV(T+d)Z level of theory) to shed light on reaction pathways and structures of the products. The kinetic data for the reaction (i.e. rate constants and branching ratios) have been computed through the RRKM method, in the 10–300 K temperature range.
According to calculations, the extent of the reaction depends on the formation of an intermediate, which lies 175 kJ mol−1 below the reactants. A deeper look at its structure reveals that the reaction occurs when the Si+ ion collides with the neutral target perpendicularly (or more generally, with a non-zero angle) relative to the principal C2 axis of the H2S molecule (i.e. along the HOMO orbital), highlighting a significant stereo-dynamic contribution to the reaction. Stereochemistry thus acts as a limiting factor for reactivity, making the collision geometry between the ion and the molecule a critical parameter. This constraint has been modelled as an energy threshold (ET) dependent on the relative angle between the reactants, with values spanning from 0 to 376 meV in the 0° to 180° range, as shown in Fig. 5.
The analytical form of the true CS as a function of collision energy was derived from the total experimental CS by constructing a fitting function that accounts for both the stereo-dynamical effects and the observed trend. Subsequently, the true CS has been used to calculate rate constants as a function of temperature, k(T). For ET in the 2–20 meV range, corresponding to an approach angle of the reactants (θ) confined in the 35°−65° interval, the retrieved k(300) is in good agreement with the SIFDT measurements (Glosík et al. 1995) and with the RRKM calculations performed in this study. For higher ET values, a significant decrease in k(T) was observed, diverging from the theoretical predictions and the rate constants reported in the literature. The rate constant as a function of temperature has been extrapolated in the 10–300 K range, with the values monotonically increasing with temperature from k = 7.0 × 10⁻¹¹ to 7.0 × 10⁻¹⁰ cm3 s−1, in contrast with the capture model predictions, showing an increase with decreasing temperature.
Once the SiSH+ ion formed, the formation of SiS has been hereby proposed and theoretically investigated as the product of the proton transfer reaction of SiSH+ with NH3, as an alternative to the electron recombination of SiS+ in ammonia-rich regions. According to the PES reported in Fig. 9, the reactants participate in the formation of a relatively stable intermediate, in which the H atom of the SiSH+ ion points toward the N atom in the ammonia molecule. Subsequently, neutral SiS is formed after the proton transfer is completed. The rate constant has been calculated using a capture approach and found to be independent on temperature. The obtained rate has been rescaled on the experimental data measured at room temperature to get the parameters α = 9.7 × 10⁻¹⁰ cm3 s−1, β=0, and γ=0.
5.2 Astrophysical implications
The new reactions reported in this study may explain the enhancement of the SiS abundance in the low-mass protostellar shocked region L1157-B1 (Podio et al. 2017). Here, the cosmicray ionisation rate in L1157-B1 is enhanced with respect to the average one, implying a greater extent of ionisation of the gas (Podio et al. 2014) and making the ionic route of SiS formation a viable one. This ionisation enhancement is likely caused by the violent shocks along the L1157 molecular outflow (e.g. Padovani et al. 2015; Gaches & Offner 2018). In this respect, we notice that the Podio et al. (2014) study provided the average gas ionisation over the entire L1157-B1 shocked region, whereas the SiS abundance is only enhanced in a small region within L1157-B1 (Podio et al. 2017), probably where the shock is more violent and, possibly, the ionisation larger.
In addition, the large abundance of ammonia measured towards L1157-B1 (Tafalla & Bachiller 1995) can also contribute to the enhancement of SiS in the small L1157-B1 region mentioned above. In the UMIST and KIDA databases, in absence of specific measurements, the branching ratio of the possible products of the SiSH+ recombination (HS + Si and SiS + H) is assumed to be 1:1 with a total rate coefficient of 3 × 10⁻⁷ cm3 s−1 and dependence with temperature of −0.5, which implies a rate of about 5.8 × 10⁻⁷ cm3 s−1 at the estimated temperature (80 K) of the L1157-B1 shocked region. Using our new estimate of the SiSH+ proton transfer to ammonia (9.7 × 10⁻¹⁰ cm3 s−1; see above), the ratio between the two processes (proton transfer over recombination) is 2 × 10⁻³ [NH3]/[e]. Considering that the average electron abundance [e] in L1157-B1 is ~10−7 (Podio et al. 2014) and that of ammonia ~10−5 (Tafalla & Bachiller 1995), the two processes are characterised by a comparable degree of importance, if the recombination rate reported in the databases is accurate.
In summary, in addition to the neutral-neutral reactions evoked in the literature (e.g. Mendoza, Edgar et al. 2024, and the other references reported in the introduction), ionic routes could also contribute or even dominate the formation of SiS in shocked regions. To explore this possibility, an estimation of whether the ionic routes are more or less important in the formation of SiS a dedicated modelling that goes beyond the scope of this work will be necessary.
6 Conclusions
This study provides experimental values of the absolute cross-sections (CSs) and product branching rations (BRs) for the ion-molecule reaction between Si+ and H2S. The CSs and BRs were measured, across a wide range of collision energies, using the GEMINI guided ion-beam set-up. The analysis of the experimental findings displays some of the inadequacies of standard capture models, usually adopted in astrochemical simulations. An empirical function, formulated taking into account basic stereo-dynamical constraints (see Eq. (15)), has been proposed and used for the description of the collision energy dependence of the total reactive CS, from which the temperature dependence of the total rate coefficient k(T) can be derived. In parallel, the theoretical investigation of the multi-dimensional SiH2S+ potential energy surface casts light on the energetic evolution of the various reaction channels and on their relative role. Theoretical calculations were performed on the potential energy surface and on the kinetics of the proton transfer reaction between SiSH+ and NH3, leading to neutral SiS. In conclusion, this study demonstrates that:
The reaction Si+ + H2S is an efficient formation route of SiSH+ and should be considered in astrochemical models of shocked regions, where atomic Si is released by the dust grains and, given its low ionisation energy, it is easily converted into Si+.
Among SiSH+ and HSiS+ ionic products, SiSH+ is the more stable isomer, with an appreciable difference in the enthalpy of formation of ~60 kJ mol−1. Therefore, we can presume that it will also be preferentially formed in the other formation routes already considered in the main astrochemical databases. Therefore, SiSH+ is the relevant interstellar ion and an important precursor for SiS formation.
The proton exchange reaction between SiSH+ and ammonia is indeed a very efficient way to convert the protonated species into neutral SiS and might even rival electron-ion recombination in ammonia-rich regions.
SiS+ is a minor product of the reaction Si+ + H2S and its yield becomes non-negligible at high temperatures or at the high total energy of the reaction transition state.
Acknowledgements
Financial support is acknowledged from the following institutions and projects: MUR PRIN 2020 project n. 2020AFB3FX “Astrochemistry beyond the second period elements”; the European Union’s Horizon 2020 research and innovation programme under the Marie Sklodowska Curie grant agreement No 811312 for the project “Astro-Chemical Origins” (ACO). MR acknowledges financial support under the National Recovery and Resilience Plan (NRRP), Mission 4, Component 2, Investment 1.1, Call for tender No. 104 published on 2.2.2022 by the Italian Ministry of University and Research (MUR), funded by the European Union – NextGenerationEU– Project Title 2022JC2Y93 Chemical Origins: linking the fossil composition of the Solar System with the chemistry of protoplanetary disks – CUP J53D23001600006 – Grant Assignment Decree No. 962 adopted on 30.06.2023 by the Italian Ministry of University and Research (MUR). Views and opinions expressed are however those of the author(s) only and do not necessarily reflect those of the European Union or European Commission. Neither the European Union nor the granting authority can be held responsible for them.
Appendix A Collision cell calibration
As discussed in the section on ‘experimental methods’ of this work, to convert relative CSs to absolute CSs, we performed calibration measurements on the Ar+ + D2 system, for which absolute CSs were already determined (Ervin & Armentrout 1985). We measured the ArD+ product intensity as a function of the D2 density in the collision cell. The datapoints have been fitted with a linear regression to get the effective length of the collision cell, which in our case resulted to be 11.4 ± 4.0 cm, see Fig. A.1.
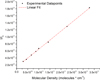 |
Fig. A.1 Experimental trends obtained for the ArD+ products from the calibration reaction as a function of the D2 density in the collision cell, measured at a collision energy ECM = 0.2 eV. The dashed lines represent the linear fits applied to the experimental data points. |
Appendix B Synthesis and purification of H2S
The synthesis of H2S has been performed and optimised by making FeS (iron sulphide, 99.9% – Sigma-Aldrich) react with HCl (Hydrochloric acid, fuming – Merck) and with H2SO4 (Sulphuric acid, 98%, Merck) according to the following reactions:
![Mathematical equation: $\[\mathrm{FeS}+\mathrm{HCl} \rightarrow \mathrm{FeCl}_2+\mathrm{H}_2 \mathrm{S}\]$](/articles/aa/full_html/2025/06/aa54558-25/aa54558-25-eq22.png) (B.1)
(B.1)
![Mathematical equation: $\[\mathrm{FeS}+\mathrm{H}_2 \mathrm{SO}_4 \rightarrow \mathrm{FeSO}_4+\mathrm{H}_2 \mathrm{S}.\]$](/articles/aa/full_html/2025/06/aa54558-25/aa54558-25-eq23.png) (B.2)
(B.2)
We tested reaction (B.1) first because the reaction with HCl is one of the most used ways to get H2S upon reaction with FeS. However, the quantity of HCl+ (m/z 36) and H2O+ (m/z 18), and also SiOH+ (m/z 45) as the result of the reaction of Si+ with H2O we were getting as parasitic signals (with a potential bias on the measured CSs). To get a cleaner H2S we performed the reaction with H2SO4 (B.2), which allowed us to produce H2S with almost no contamination ascribable to water. The amount of water transferred into the gas bottle has been further reduced after sending H2S through a tube filled with CaCl2 beads. To avoid air entering the reaction flask, the synthesis was performed in a set-up under vacuum (see Fig. B.1). Nonetheless, when injecting H2SO4, possible air contamination could have been introduced. To make sure no air was present during the measurements, we purified H2S after four pump-freeze-thaw cycles before injection into the scattering cell.
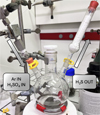 |
Fig. B.1 Experimental set-up used for the synthesis of H2S. |
Appendix C Absolute reactive CS measurement as a function of pressure
We measured the I/I0 ratio as a function of the density of the neutral reactant (H2S), at a chosen collision energy (ECM) value (e.g. 0.1 eV). Fitting the datapoints with a line, we are able to extract the value of the absolute reactive CS (see Fig. C.1). This measurement is repeated at different ECM values, and then used to readjust the experimental trend for the CSs as a function of the collision energy. This accounts for sudden pressure changes in the reaction cell, allowing us to be more accurate with the description of the trend of the CSs.
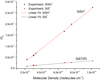 |
Fig. C.1 Experimental trends obtained for the products of the reaction of Si+ with H2S at ECM = 0.1 eV. The dashed lines represent the linear fits applied to the experimental data points. |
Appendix D Energy analysis of the stationary points for the Si+ + H2S reaction
The potential energy surface (PES) for the Si+ + H2S reaction was investigated performing a first analysis at the B3LYP/aug-cc-pV(T+d)Z level of theory. Subsequently the data were refined at the more accurate CCSD(T)/aug-cc-pV(T+d)Z level and the energy of all the stationary points were evaluated at the CCSD(T)/CBS level of theory. In Table D.1 we report the enthalpy changes and barrier heights for the various reaction channels identified in the PES at all the three levels of theory considered in the analysis.
Enthalpy changes (![Mathematical equation: $\[\Delta \mathrm{H}_{0}^{0}\]$](/articles/aa/full_html/2025/06/aa54558-25/aa54558-25-eq24.png) ) and Barrier Heights, expressed in kJ mol−1, evaluated at the three different levels of theory for the Si+ + H2S reaction
) and Barrier Heights, expressed in kJ mol−1, evaluated at the three different levels of theory for the Si+ + H2S reaction
Appendix E Geometrical parameters of the identified stationary points for the Si+ + H2S and SiSH+ + NH3 reactions
In Figs. E.1, E.2, and E.3, we report the geometry and the cartesian coordinates of all the stationary points (including minima, transition states, reactants, and products) identified in the potential energy surface for the Si+ + H2S and SiSH+ + NH3 reactions. Since very small (almost negligible) deviations were noticed between the geometries obtained at the two different levels of theory (see Section 2.1 for details), we report only the data obtained through the B3LYP/aug-cc-pV(T+d)Z calculations.
 |
Fig. E.1 Geometry, cartesian coordinates (in black) and harmonic vibrational frequencies (in blue) of the stationary points identified in the PES for the Si+ + H2S reaction. |
 |
Fig. E.2 Geometry, cartesian coordinates (in black) and harmonic vibrational frequencies (in blue) of the stationary points identified in the PES for the Si+ + H2S reaction. |
 |
Fig. E.3 Geometry, cartesian coordinates (in black) and harmonic vibrational frequencies (in blue) of the stationary points identified in the PES for the Si+ + H2S and SiSH+ + NH3 reactions. |
References
- Andreazza, C. M., & Marinho, E. P. 2007, MNRAS, 380, 365 [Google Scholar]
- Apponi, A. J., McCarthy, M. C., Gottlieb, C. A., & Thaddeus, P. 1999, ApJ, 516, L103 [Google Scholar]
- Ascenzi, D., Cont, N., Guella, G., Franceschi, P., & Tosi, P. 2007, J. Phys. Chem. A, 111, 12513 [CrossRef] [Google Scholar]
- Asplund, M., Grevesse, N., Sauval, A. J., & Scott, P. 2009, ARA&A, 47, 481 [NASA ADS] [CrossRef] [Google Scholar]
- Balucani, N., Bergeat, A., Cartechini, L., et al. 2009, J. Phys. Chem. A, 113, 11138 [Google Scholar]
- Balucani, N., Skouteris, D., Leonori, F., et al. 2012, J. Phys. Chem. A, 116, 10467 [Google Scholar]
- Balucani, N., Caracciolo, A., Vanuzzo, G., et al. 2023, Faraday Discuss., 245, 327 [Google Scholar]
- Bartlett, R. J. 1981, Ann. Rev. Phys. Chem., 32, 359 [Google Scholar]
- Bass, L., Su, T., Chesnavich, W., & Bowers, M. 1975, Chem. Phys. Lett., 34, 119 [NASA ADS] [CrossRef] [Google Scholar]
- Becke, A. D. 1993, J. Chem. Phys., 98, 1372 [Google Scholar]
- Bruna, P., & Grein, F. 1992, J. Phys. Chem., 96, 6617 [Google Scholar]
- Calamai, A. G., Smith, P. L., & D., B. 1993, ApJ, 415, L59 [NASA ADS] [CrossRef] [Google Scholar]
- Cernicharo, J., Gottlieb, C. A., Guelin, M., Thaddeus, P., & Vrtilek, J. M. 1989, ApJ, 341, L25 [NASA ADS] [CrossRef] [Google Scholar]
- Cernicharo, J., McCarthy, M. C., Gottlieb, C. A., et al. 2015, ApJ, 806, L3 [Google Scholar]
- Cernicharo, J., Agúndez, M., Velilla Prieto, L., et al. 2017, A&A, 606, L5 [NASA ADS] [CrossRef] [EDP Sciences] [Google Scholar]
- Chantry, P. J. 1971, J. Chem. Phys., 55, 2746 [Google Scholar]
- Dickinson, D. F., & Kuiper, E. N. R. 1981, ApJ, 247, 112 [NASA ADS] [CrossRef] [Google Scholar]
- Doddipatla, S., He, C., Goettl, S. J., et al. 2021, Sci. Adv., 7, eabg7003 [NASA ADS] [CrossRef] [Google Scholar]
- Draine, B. T. 2003, ARA&A, 41, 241 [NASA ADS] [CrossRef] [Google Scholar]
- Dunning Jr, T. H. 1989, J. Chem. Phys., 90, 1007 [NASA ADS] [CrossRef] [Google Scholar]
- Ervin, K. M., & Armentrout, P. B. 1985, J. Chem. Phys., 83, 166 [Google Scholar]
- Falcinelli, S., Rosi, M., Cavalli, S., Pirani, F., & Vecchiocattivi, F. 2016, Chem. Eur. J., 22, 12518 [Google Scholar]
- Falcinelli, S., Cappelletti, D., Vecchiocattivi, F., & Pirani, F. 2023, Phys. Chem. Chem. Phys., 25, 16176 [Google Scholar]
- Fortenberry, R. C., & McGuire, B. A. 2024, ApJ, 971, 101 [Google Scholar]
- Fox, A., Wlodek, S., Hopkinson, A. C., et al. 1989, J. Phys. Chem., 93, 1549 [Google Scholar]
- Franceschi, P., Penasa, L., Ascenzi, D., et al. 2007, Int. J. Mass Spectrom., 265, 224 [NASA ADS] [CrossRef] [Google Scholar]
- Frisch, M., Trucks, G., Schlegel, H., et al. 2009, Gaussian 09, Revision A. 02, 2009 (Wallingford, CT: Gaussian, Inc.) [Google Scholar]
- Gaches, B. A. L., & Offner, S. S. R. 2018, ApJ, 861, 87 [NASA ADS] [CrossRef] [Google Scholar]
- Galvão, B. R. L., Caridade, P. J. S. B., Mota, V. C., & Varandas, A. J. C. 2023, MNRAS, 525, 5353 [CrossRef] [Google Scholar]
- Giani, L., Ceccarelli, C., Mancini, L., et al. 2023, MNRAS, 526, 4535 [NASA ADS] [CrossRef] [Google Scholar]
- Glosík, J., Zakouřil, P., & Lindinger, W. 1995, J. Chem. Phys., 103, 6490 [Google Scholar]
- Goldhaber, D. M., & Betz, A. L. 1984, ApJ, 279, L55 [NASA ADS] [CrossRef] [Google Scholar]
- Gonzalez, C., & Schlegel, H. B. 1989, J. Chem. Phys., 90, 2154 [Google Scholar]
- Gonzalez, C., & Schlegel, H. B. 1990, J. Chem. Phys., 94, 5523 [Google Scholar]
- Gry, C., Pineau des Forêts, G., & Walmsley, C. M. 1999, A&A, 348, 227 [NASA ADS] [Google Scholar]
- Hanwell, M. D., Curtis, D. E., Lonie, D. C., et al. 2012, J. Cheminform., 4, 1 [Google Scholar]
- Herbst, E., Chang, Q., & Cuppen, H. M. 2005, J. Phys. Conf. Ser., 6, 18 [Google Scholar]
- Kendall, R. A., Dunning Jr, T. H., & Harrison, R. J. 1992, J. Chem. Phys., 96, 6796 [NASA ADS] [CrossRef] [Google Scholar]
- Klippenstein, S. J. 1992, J. Chem. Phys., 96, 367 [NASA ADS] [CrossRef] [Google Scholar]
- Kosmas, A. 1984, J. Physique Lett., 45, 1083 [CrossRef] [EDP Sciences] [Google Scholar]
- Leonori, F., Skouteris, D., Petrucci, R., et al. 2013, J. Chem. Phys., 138, 024311 [Google Scholar]
- Li, A., & Draine, B. T. 2001, ApJ, 554, 778 [Google Scholar]
- Linstrom, P. J., & Mallard, W. G. 2024, NIST Chemistry WebBook – Standard Reference Database no. 69 (National Institute of Standards and Technology), http://webbook.nist.gov [Google Scholar]
- Lodders, K. 2020, Solar Elemental Abundances (Oxford University Press) [Google Scholar]
- Lorenzetti, D., Tommasi, E., Giannini, T., et al. 1999, A&A, 346, 604 [NASA ADS] [Google Scholar]
- Mancini, L., Vanuzzo, G., Marchione, D., et al. 2021, J. Phys. Chem. A, 125, 8846 [Google Scholar]
- Mancini, L., Trinari, M., de Aragão, E. V. F., Rosi, M., & Balucani, N. 2022, The S+(4S)+SiH2(1A1) Reaction: Toward the Synthesis of Interstellar SiS (Springer International Publishing), 233 [Google Scholar]
- Mancini, L., Valença Ferreira De Aragão, E., Pirani, F., et al. 2024, A&A, 691, A83 [NASA ADS] [CrossRef] [EDP Sciences] [Google Scholar]
- Marchione, D., Mancini, L., Liang, P., et al. 2022, J. Phys. Chem. A, 126, 3569 [NASA ADS] [CrossRef] [Google Scholar]
- Martin, J. M. 1996, Chem. Phys. Lett., 259, 669 [Google Scholar]
- Massalkhi, S., Jiménez-Serra, I., Martín-Pintado, J., et al. 2023, A&A, 678, A45 [NASA ADS] [CrossRef] [EDP Sciences] [Google Scholar]
- Mendoza, Edgar, Costa, Samuel F. M., Carvajal, Miguel, et al. 2024, A&A, 687, A149 [NASA ADS] [CrossRef] [EDP Sciences] [Google Scholar]
- Millar, T. J., Walsh, C., Van de Sande, M., & Markwick, A. J. 2024, A&A, 682, A109 [NASA ADS] [CrossRef] [EDP Sciences] [Google Scholar]
- Morris, M., Gilmore, W., Palmer, P., Turner, B. E., & Zuckerman, B. 1975, ApJ, 199, L47 [NASA ADS] [CrossRef] [Google Scholar]
- Mota, V. C., Varandas, A. J. C., Mendoza, E., Wakelam, V., & Galvão, B. R. L. 2021, ApJ, 920, 37 [NASA ADS] [CrossRef] [Google Scholar]
- Mota, V. C., Caridade, P. J. S. B., Varandas, A. J. C., & Galvao, B. R. L. 2022, J. Phys. Chem. A, 126, 3555 [NASA ADS] [CrossRef] [Google Scholar]
- Müller, H. S. P., Thorwirth, S., Roth, D. A., & Winnewisser, G. 2001, A&A, 370, L49 [Google Scholar]
- Ohishi, M., Kaifu, N., Kawaguchi, K., et al. 1989, ApJ, 345, L83 [CrossRef] [Google Scholar]
- Olney, T. N., Cann, N., Cooper, G., & Brion, C. 1997, Chem. Phys., 223, 59 [NASA ADS] [CrossRef] [Google Scholar]
- Olsen, J., Jo/rgensen, P., Koch, H., Balkova, A., & Bartlett, R. J. 1996, J. Chem. Phys., 104, 8007 [Google Scholar]
- Padovani, M., Hennebelle, P., Marcowith, A., & Ferrière, K. 2015, A&A, 582, L13 [NASA ADS] [CrossRef] [EDP Sciences] [Google Scholar]
- Peng, T. C., Humphreys, E. M. L., Testi, L., et al. 2013, A&A, 559, L8 [NASA ADS] [CrossRef] [EDP Sciences] [Google Scholar]
- Pirani, F., Brizi, S., Roncaratti, L. F., et al. 2008, Phys. Chem. Chem. Phys., 10, 5489 [Google Scholar]
- Podio, L., Lefloch, B., Ceccarelli, C., Codella, C., & Bachiller, R. 2014, A&A, 565, A64 [NASA ADS] [CrossRef] [EDP Sciences] [Google Scholar]
- Podio, L., Codella, C., Lefloch, B., et al. 2017, MNRAS, 470, L16 [Google Scholar]
- Raghavachari, K., Trucks, G. W., Pople, J. A., & Head-Gordon, M. 1989, Chem. Phys. Lett., 157, 479 [Google Scholar]
- Richardson, V., de Aragão, E. V. F., He, X., et al. 2022, Phys. Chem. Chem. Phys., 24, 22437 [Google Scholar]
- Rosi, M., Mancini, L., Skouteris, D., et al. 2018, Chem. Phys. Lett., 695, 87 [NASA ADS] [CrossRef] [Google Scholar]
- Rosi, M., Skouteris, D., Balucani, N., et al. 2019, in Computational Science and Its Applications – ICCSA 2019, eds. S. Misra, O. Gervasi, B. Murgante, et al. (Cham: Springer International Publishing), 306 [Google Scholar]
- Rubin, M., Altwegg, K., Berthelier, J.-J., et al. 2022, A&A, 658, A87 [NASA ADS] [CrossRef] [EDP Sciences] [Google Scholar]
- Ruscic, B., & Bross, D. 2020, Active Thermochemical Tables (ATcT) values based on ver. 1.122p of the Thermochemical Network, https://atct.anl.gov/Thermochemical%20Data/version%201.122/ [Google Scholar]
- Russell, D. J. III 2022, NIST Computational Chemistry Comparison and Benchmark Database, NIST Standard Reference Database Number 101, http://cccbdb.nist.gov/ [Google Scholar]
- Schilke, P., Leurini, S., Menten, K. M., & Alcolea, J. 2003, A&A, 412, L15 [NASA ADS] [CrossRef] [EDP Sciences] [Google Scholar]
- Skouteris, D., Balucani, N., Ceccarelli, C., et al. 2019, MNRAS, 482, 3567 [CrossRef] [Google Scholar]
- Stephens, P. J., Devlin, F. J., Chabalowski, C. F., & Frisch, M. J. 1994, J. Phys. Chem., 98, 11623 [CrossRef] [Google Scholar]
- Su, T., & Chesnavich, W. J. 1982, J. Chem. Phys., 76, 5183 [NASA ADS] [CrossRef] [Google Scholar]
- Su, T., Su, E. C. F., & Bowers, M. T. 1978, J. Chem. Phys., 69, 2243 [NASA ADS] [CrossRef] [Google Scholar]
- Tafalla, M., & Bachiller, R. 1995, ApJ, 443, L37 [Google Scholar]
- Taquet, V., Wirström, E., & Charnley, S. 2016, ApJ, 821, 46 [NASA ADS] [CrossRef] [Google Scholar]
- Teloy, E., & Gerlich, D. 1974, Chem. Phys., 4, 417 [NASA ADS] [CrossRef] [Google Scholar]
- Tosi, P., Dmitriev, O., Bassi, D., Wick, O., & Gerlich, D. 1994, J. Chem. Phys., 100, 4300 [Google Scholar]
- Tsikritea, A., Diprose, J. A., Softley, T. P., & Heazlewood, B. R. 2022, J. Chem. Phys., 157, 060901 [NASA ADS] [CrossRef] [Google Scholar]
- Turner, B. E. 1987, A&A, 183, L23 [Google Scholar]
- Vanuzzo, G., Mancini, L., Pannacci, G., et al. 2022a, ACS Earth Space Chem., 6, 2305 [Google Scholar]
- Vanuzzo, G., Marchione, D., Mancini, L., et al. 2022b, J. Phys. Chem. A, 126, 6110 [Google Scholar]
- Viswanathan, R., & Dyke, T. 1984, J. Mol. Spectrosc., 103, 231 [Google Scholar]
- Wakelam, V., Loison, J.-C., Herbst, E., et al. 2015, ApJ Suppl. Ser., 217, 20 [Google Scholar]
- Wakelam, V., Gratier, P., Loison, J.-C., et al. 2024, A&A, 689, A63 [NASA ADS] [CrossRef] [EDP Sciences] [Google Scholar]
- Werner, H.-J., Knowles, P. J., Manby, F. R., et al. 2020, J. Chem. Phys., 152, 144107 [NASA ADS] [CrossRef] [Google Scholar]
- Wlodek, S., Fox, A., & Bohme, D. 1987, JACS, 109, 6663 [Google Scholar]
- Wlodek, S., & Bohme, D. K. 1989, J. Chem. Soc., Faraday Trans. 2, 85, 1643 [CrossRef] [Google Scholar]
- Woon, D. E., & Dunning Jr, T. H. 1993, J. Chem. Phys., 98, 1358 [NASA ADS] [CrossRef] [Google Scholar]
- Zanchet, A., Roncero, O., Agundez, M., & Cernicharo, J. 2018, ApJ, 862, 38 [NASA ADS] [CrossRef] [Google Scholar]
- Zilinskas, M., van Buchem, C. P. A., Miguel, Y., et al. 2022, A&A, 661, A126 [NASA ADS] [CrossRef] [EDP Sciences] [Google Scholar]
- Zilinskas, M., Miguel, Y., van Buchem, C. P. A., & Snellen, I. A. G. 2023, A&A, 671, A138 [NASA ADS] [CrossRef] [EDP Sciences] [Google Scholar]
All Tables
Reaction enthalpies (ΔH) for the products of the reaction of Si+ with H2S from the literature and our calculations.
Rate coefficients k(T) and branching ratios (BR) for the Si+(2P)+H2S(1A1) reaction at different temperatures (T) from RRKM calculations.
Total rate constant coefficients (α, β, and γ) and BRs for the reaction Si+(2P) + H2S(1A1).
Enthalpy changes () and Barrier Heights, expressed in kJ mol−1, evaluated at the three different levels of theory for the Si+ + H2S reaction
All Figures
|
Fig. 1 Typical normalized trend for the parent ion (blue squares) as a function of the octopole DC voltage. In this case, the red dotted trend represents the first derivative of the experimental points, while the black solid curve, with FWHM ~1.15 V in the laboratory frame, gives the best fit of the red data points. |
| In the text | |
|
Fig. 2 Experimental cross-section (CS) for the reaction channels as a function of the collision energy ECM. The black solid squares are the absolute CSs for the main channel at m/z 61 (SiSH+/HSiS+), while the blue up-pointing triangles refer to the SiS+ product, at m/z 60. |
| In the text | |
|
Fig. 3 Total CSs for the reaction of Si+ with H2S as a function of collision energy ECM. The black filled diamonds are the experimental data, the blue filled triangles and the red open diamonds are the CSs as estimated from simple capture models, (i.e. Langevin’s and the average dipole orientation model, respectively). The red and green dashed curves are from our fitted model to extract the true CS from the experimental data: the red curve represents the fitting function, obtained by modelling the effective CS, as in Eq. (14); while the green dashed line represents the form of the true CS extracted as a result of the fitting procedure. Further details are discussed in Sect. 4.4. |
| In the text | |
|
Fig. 4 Schematic representation of the PES obtained for the Si+(2P)+H2S (1A1) reaction with energies (in kJ mol−1) evaluated at the CCSD(T)/CBS//CCSD(T)/aug-cc-pV(T+d)Z level of theory. Data obtained at the CCSD(T)/aug-cc-pV(T+d)Z level of theory are reported (in blue) in parenthesis. |
| In the text | |
|
Fig. 5 a) Schematic representation of the Si+−H2S reactive system. The H2S molecule is bound within the xz plane, while the Si+ ion moves within the yz plane, at a fixed distance from the molecule (i.e. the equilibrium Si-S bond length R = 3.8 Å) and with an angle, θ, with respect to the xz plane. As the ion moves, it probes the electrostatic potential from z = −R to z = +R. b) Energy barrier (ET) as a function of θ: the electrostatic potential increases as the ion moves from θ = 0° to 180° in the yz plane, with an increase of the repulsive contribution given by the hydrogen atoms. The barrier is obtained as a difference between the effective potential calculated at θ = θ′ and θ = 0°. The inset is an expansion of the yellow area in the main graph. |
| In the text | |
|
Fig. 6 Schematic representation of the stereo-dynamical effect of the collision between the two reaction partners, Si+ and H2S, in two limiting cases: a) for an approach at θ = 90° (i.e. perpendicular to the principal C2 axis), the ion probes the interaction with the HOMO orbital of the H2S molecule, favouring the formation of the MIN1 intermediate; b) as the ion approaches along the nodal plane (θ = 0°), no orbital overlap exists, thus leading to a non-reactive collision. |
| In the text | |
|
Fig. 7 Unimolecular rate constants for the exothermic channels as a function of energy (ϵ). Top panel: processes leading to products via decomposition from the various intermediates. Bottom panel: processes leading to the interconversion of intermediates. |
| In the text | |
|
Fig. 8 Total rate constants, k, as a function of temperature, T, for the reaction Si+ with H2S estimated using various capture models and our results. Extrapolated rates from our experimental CSs (with ET=2 meV; see Sect. 4.4) are shown as orange open triangles, while RRKM calculations (see Sect. 4.5) are shown as cyan filled stars. The other trends are: red open diamonds showing the Langevin model; blue solid triangles showing the scaled averaged dipole orientation (ADO) model with a c value of 0.145; black solid circles showing the Su and Chesnavich model derived from an empirical fit of variational transition state theory and classical trajectory calculations for point charged ions and polar neutrals (Su & Chesnavich 1982); green solid squares showing the average cosθ method (Kosmas 1984); black open circle showing the measured datapoint by Glosík et al. (1995), with the relative ±30% error bar. |
| In the text | |
|
Fig. 9 Schematic representation of the potential energy surface obtained for the SiSH+(1A1)+NH3(1A1) reaction with energies (in kJ mol−1) evaluated at the CCSD(T)/CBS//CCSD(T)/aug-cc-pV(T+d)Z level of theory. Data obtained at the CCSD(T)/aug-cc-pV(T+d)Z level of theory are reported (in blue) within the parenthesis. |
| In the text | |
|
Fig. A.1 Experimental trends obtained for the ArD+ products from the calibration reaction as a function of the D2 density in the collision cell, measured at a collision energy ECM = 0.2 eV. The dashed lines represent the linear fits applied to the experimental data points. |
| In the text | |
|
Fig. B.1 Experimental set-up used for the synthesis of H2S. |
| In the text | |
|
Fig. C.1 Experimental trends obtained for the products of the reaction of Si+ with H2S at ECM = 0.1 eV. The dashed lines represent the linear fits applied to the experimental data points. |
| In the text | |
|
Fig. E.1 Geometry, cartesian coordinates (in black) and harmonic vibrational frequencies (in blue) of the stationary points identified in the PES for the Si+ + H2S reaction. |
| In the text | |
|
Fig. E.2 Geometry, cartesian coordinates (in black) and harmonic vibrational frequencies (in blue) of the stationary points identified in the PES for the Si+ + H2S reaction. |
| In the text | |
|
Fig. E.3 Geometry, cartesian coordinates (in black) and harmonic vibrational frequencies (in blue) of the stationary points identified in the PES for the Si+ + H2S and SiSH+ + NH3 reactions. |
| In the text | |
Current usage metrics show cumulative count of Article Views (full-text article views including HTML views, PDF and ePub downloads, according to the available data) and Abstracts Views on Vision4Press platform.
Data correspond to usage on the plateform after 2015. The current usage metrics is available 48-96 hours after online publication and is updated daily on week days.
Initial download of the metrics may take a while.