Open Access
Fig. 1
Download original image
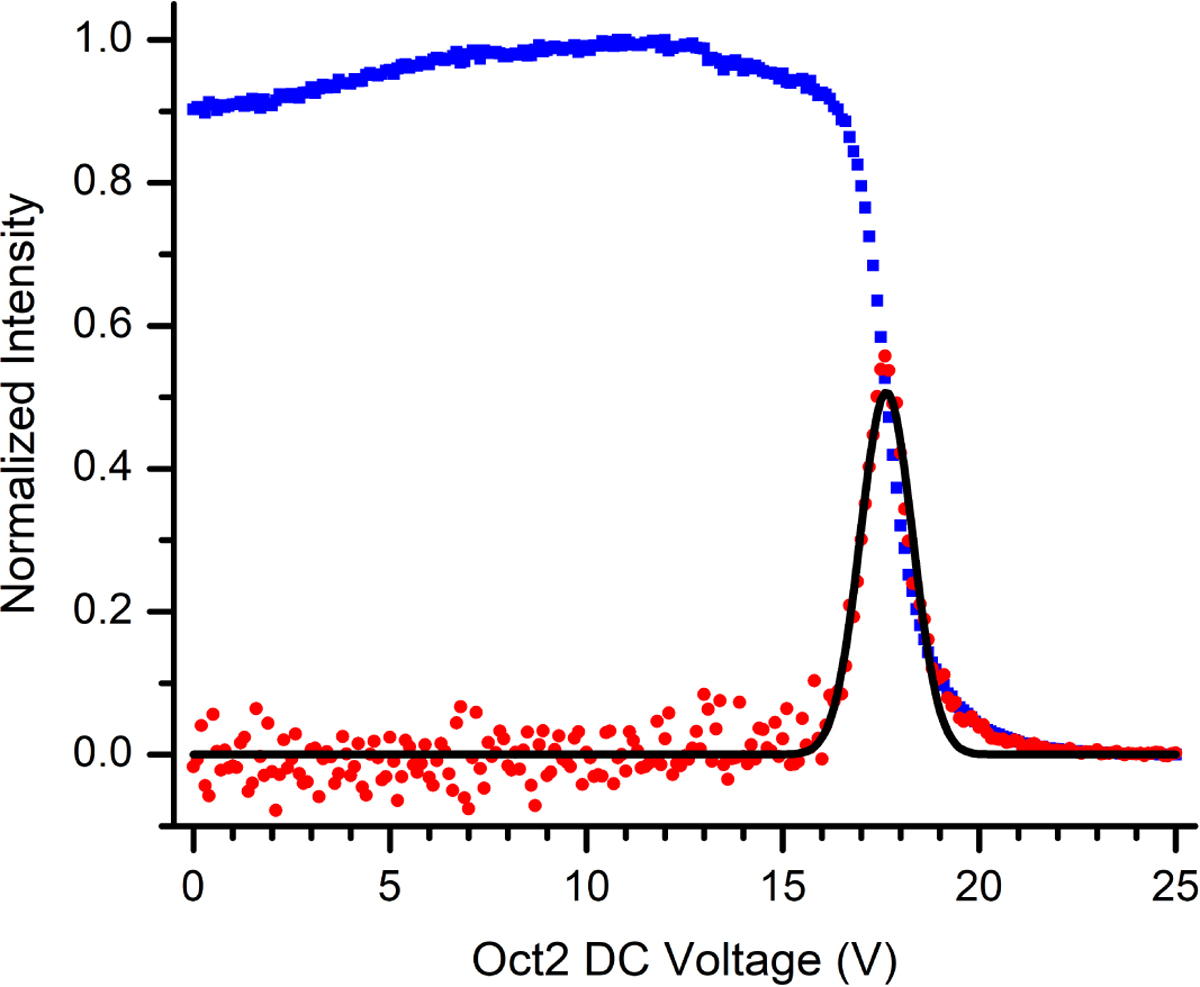
Typical normalized trend for the parent ion (blue squares) as a function of the octopole DC voltage. In this case, the red dotted trend represents the first derivative of the experimental points, while the black solid curve, with FWHM ~1.15 V in the laboratory frame, gives the best fit of the red data points.
Current usage metrics show cumulative count of Article Views (full-text article views including HTML views, PDF and ePub downloads, according to the available data) and Abstracts Views on Vision4Press platform.
Data correspond to usage on the plateform after 2015. The current usage metrics is available 48-96 hours after online publication and is updated daily on week days.
Initial download of the metrics may take a while.