Fig. 3
Download original image
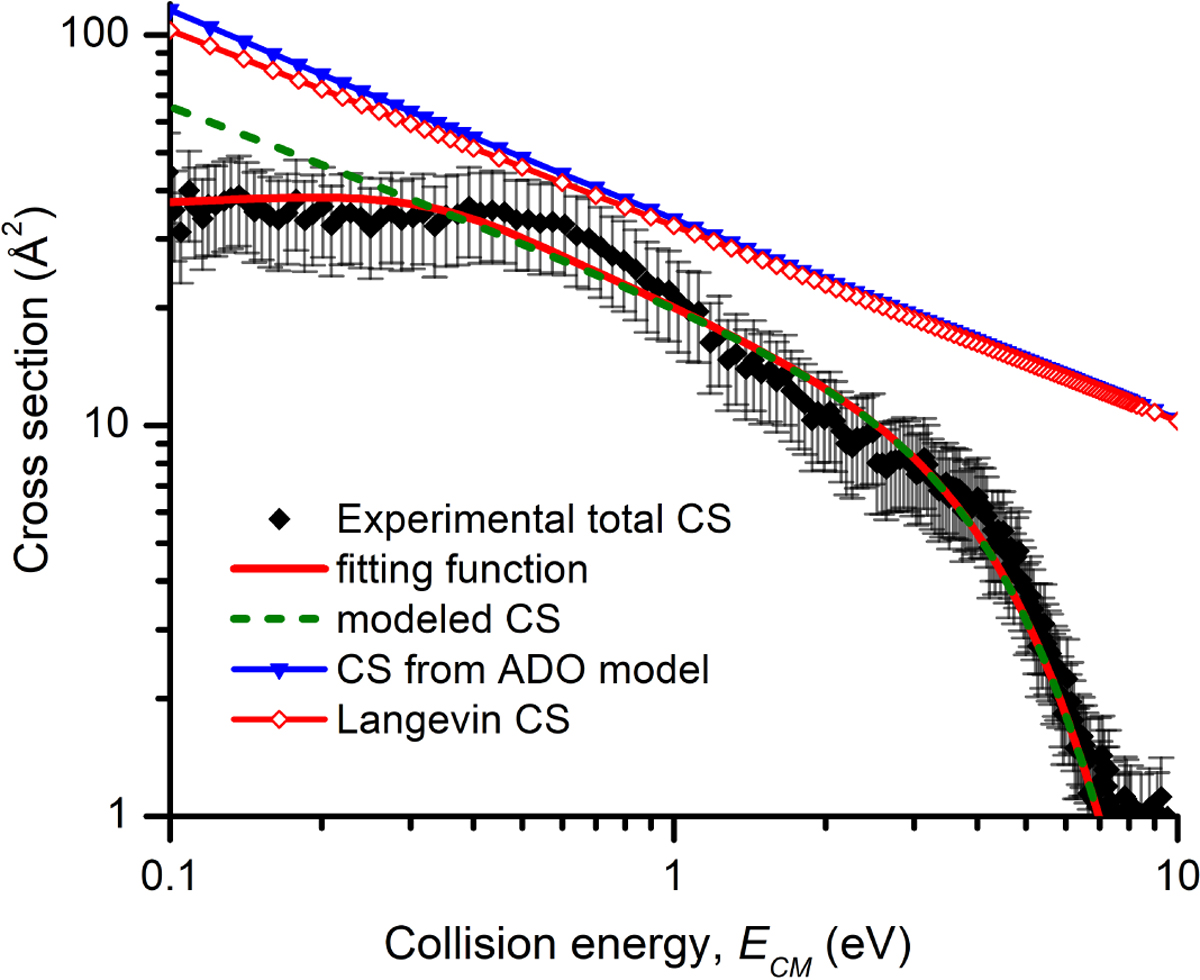
Total CSs for the reaction of Si+ with H2S as a function of collision energy ECM. The black filled diamonds are the experimental data, the blue filled triangles and the red open diamonds are the CSs as estimated from simple capture models, (i.e. Langevin’s and the average dipole orientation model, respectively). The red and green dashed curves are from our fitted model to extract the true CS from the experimental data: the red curve represents the fitting function, obtained by modelling the effective CS, as in Eq. (14); while the green dashed line represents the form of the true CS extracted as a result of the fitting procedure. Further details are discussed in Sect. 4.4.
Current usage metrics show cumulative count of Article Views (full-text article views including HTML views, PDF and ePub downloads, according to the available data) and Abstracts Views on Vision4Press platform.
Data correspond to usage on the plateform after 2015. The current usage metrics is available 48-96 hours after online publication and is updated daily on week days.
Initial download of the metrics may take a while.