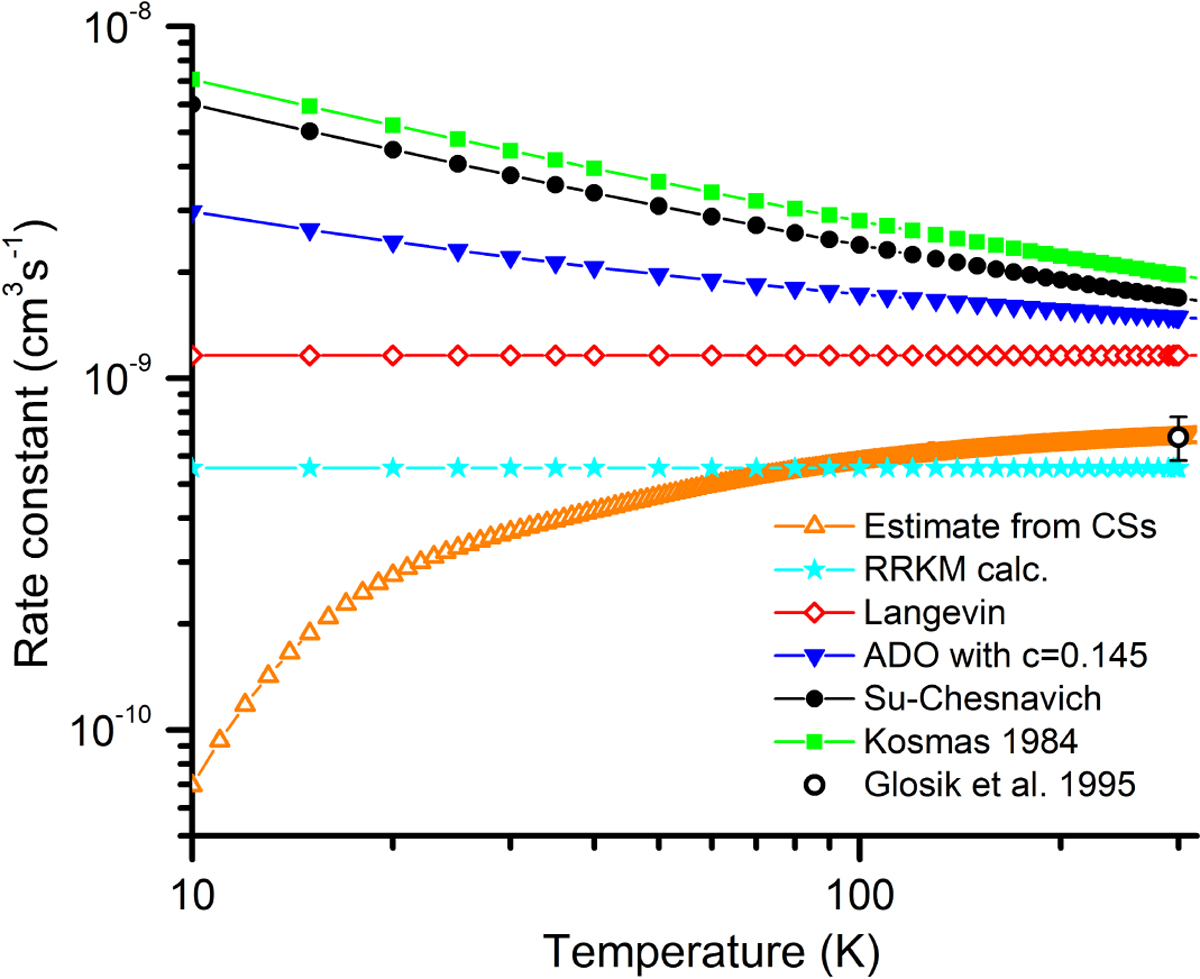
Fig. 8
Download original image
Total rate constants, k, as a function of temperature, T, for the reaction Si+ with H2S estimated using various capture models and our results. Extrapolated rates from our experimental CSs (with ET=2 meV; see Sect. 4.4) are shown as orange open triangles, while RRKM calculations (see Sect. 4.5) are shown as cyan filled stars. The other trends are: red open diamonds showing the Langevin model; blue solid triangles showing the scaled averaged dipole orientation (ADO) model with a c value of 0.145; black solid circles showing the Su and Chesnavich model derived from an empirical fit of variational transition state theory and classical trajectory calculations for point charged ions and polar neutrals (Su & Chesnavich 1982); green solid squares showing the average cosθ method (Kosmas 1984); black open circle showing the measured datapoint by Glosík et al. (1995), with the relative ±30% error bar.
Current usage metrics show cumulative count of Article Views (full-text article views including HTML views, PDF and ePub downloads, according to the available data) and Abstracts Views on Vision4Press platform.
Data correspond to usage on the plateform after 2015. The current usage metrics is available 48-96 hours after online publication and is updated daily on week days.
Initial download of the metrics may take a while.