| Issue |
A&A
Volume 698, May 2025
|
|
|---|---|---|
| Article Number | A38 | |
| Number of page(s) | 13 | |
| Section | Stellar atmospheres | |
| DOI | https://doi.org/10.1051/0004-6361/202452623 | |
| Published online | 28 May 2025 | |
Binarity at LOw Metallicity (BLOeM)
Multiplicity properties of Oe and Be stars★
1
Anton Pannekoek Institute for Astronomy, University of Amsterdam,
Science Park 904,
1098 XH
Amsterdam,
The Netherlands
2
ESO – European Southern Observatory,
Karl-SchwarzschildStrasse 2,
85748
Garching bei München,
Germany
3
The School of Physics and Astronomy, Tel Aviv University,
Tel Aviv
6997801,
Israel
4
Institute of Astronomy, KU Leuven,
Celestijnenlaan 200D,
3001
Leuven,
Belgium
5
Leuven Gravity Institute, KU Leuven,
Celestijnenlaan 200D
box 2415,
3001
Leuven,
Belgium
6
Royal Observatory of Belgium,
Avenue Circulaire/Ringlaan 3,
1180
Brussels,
Belgium
7
Department of Physics & Astronomy, Hounsfield Road, University of Sheffield,
Sheffield
S3 7RH,
UK
8
Argelander-Institut für Astronomie, Universität Bonn,
Auf dem Hügel 71,
53121
Bonn,
Germany
9
Instituto de Astrofísica de Canarias, C. Vía Láctea,
s/n,
38205
La Laguna, Santa Cruz de Tenerife,
Spain
10
Universidad de La Laguna, Dpto. Astrofísica, Av. Astrofśico Francisco Sánchez,
38206 La Laguna,
Santa Cruz de Tenerife,
Spain
11
Centro de Astrobiología (CSIC-INTA),
Ctra. Torrejón a Ajalvir km 4,
28850
Torrejón de Ardoz,
Spain
12
Max-Planck-Institut für Astronomie,
Königstuhl 17,
69117
Heidelberg,
Germany
13
School of Mathematics, Statistics and Physics, Newcastle University,
Newcastle upon Tyne
NE1 7RU,
UK
14
Max-Planck-Institute for Astrophysics,
Karl-Schwarzschild-Strasse 1,
85748
Garching,
Germany
15
Department of Astrophysics and Planetary Science, Villanova University,
800 E Lancaster Ave.,
PA
19085,
USA
16
Institute of Astronomy, University of Cambridge,
Madingley Road,
Cambridge
CB3 0HA,
UK
17
Institute of Science and Technology Austria (ISTA),
Am Campus 1,
3400
Klosterneuburg,
Austria
18
Astrophysics Group, Department of Physics, University of Surrey,
Guildford
GU2 7XH,
UK
19
Gemini Observatory/NSF’s NOIRLab, Casilla
603,
La Serena,
Chile
20
Center for Computational Astrophysics, Division of Science, National Astronomical Observatory of Japan, 2-21-1, Osawa, Mitaka,
Tokyo
181-8588,
Japan
21
Astronomical Institute, Academy of Sciences of the Czech Republic,
Fričova 298,
251 65
Ondřejov,
Czech Republic
22
School of Physics and Astronomy, Monash University,
Clayton,
VIC 3800,
Australia
23
ARC Centre of Excellence for Gravitational-wave Discovery (OzGrav),
Melbourne,
Australia
24
IAASARS, National Observatory of Athens,
15236
Penteli,
Greece
25
Institute of Astrophysics, FORTH,
GR-71110,
Heraklion,
Greece
26
Institut für Physik und Astronomie, Universität Potsdam,
Karl-Liebknecht-Str. 24/25,
14476
Potsdam,
Germany
27
Zentrum für Astronomie der Universität Heidelberg, Astronomisches Rechen-Institut,
Mönchhofstr. 12-14,
69120
Heidelberg,
Germany
28
Observatório Nacional, R. Gen. José Cristino,
77 – Vasco da Gama,
Rio de Janeiro,
RJ 20921-400,
Brazil
29
Department of Astronomy & Steward Observatory,
933 N. Cherry Ave.,
Tucson,
AZ 85721,
USA
30
Heidelberger Institut für Theoretische Studien,
SchlossWolfsbrunnenweg 35,
69118
Heidelberg,
Germany
31
Institute of Astronomy, Faculty of Physics, Astronomy and Informatics, Nicolaus Copernicus University,
Grudziadzka 5,
87-100
Torun,
Poland
32
Lennard-Jones Laboratories, Keele University,
ST5 5BG,
UK
33
Armagh Observatory, College Hill,
Armagh BT61 9DG,
Northern Ireland,
UK
★★ Corresponding author: j.bodensteiner@uva.nl
Received:
15
October
2024
Accepted:
10
January
2025
Context. Rapidly rotating classical OBe stars have been proposed as the products of binary interactions, and the fraction of Be stars with compact companions implies that at least some are. However, to constrain the interaction physics spinning up the OBe stars, a large sample of homogeneously analyzed OBe stars with well-determined binary characteristics and orbital parameters are required.
Aims. We investigated the multiplicity properties of a sample of 18 Oe, 62 Be, and two Of?p stars observed within the BLOeM survey in the Small Magellanic Cloud. We analyzed the first nine epochs of spectroscopic observations obtained over approximately three months in 2023.
Methods. Radial velocities (RVs) of all stars were measured using cross-correlation based on different sets of absorption and emission lines. Applying commonly used binarity criteria, we classified objects as binaries, binary candidates, and apparently single (RV stable) objects. We further inspected the spectra for double-lined spectroscopic binaries and cross-matched with catalogs of X-ray sources and photometric binaries.
Results. We classify 14 OBe stars as binaries, and an additional 11 as binary candidates. The two Of?p stars are apparently single. We find two more objects that are most likely currently interacting binaries. Without those, the observed binary fraction for the remaining OBe sample of 78 stars is fobs+candOBe = 0.18 ± 0.04 (fobs+candOBe = 0.32±0.05 including candidates). This binary fraction is less than half of that measured for OB stars in BLOeM. Combined with the lower fraction of SB2s, this suggests that OBe stars do indeed have fundamentally different present-day binary properties than OB stars. We find no evidence for OBe binaries with massive compact companions, in contrast to expectations from binary population synthesis.
Conclusions. Our results support the binary scenario as an important formation channel for OBe stars, as post-interaction binaries may have been disrupted or the stripped companions of OBe stars are harder to detect. Further observations are required to characterize the detected binaries, their orbital parameters, and the nature of their companions.
Key words: binaries: close / binaries: spectroscopic / stars: emission-line, Be / stars: massive / Magellanic Clouds
© The Authors 2025
 Open Access article, published by EDP Sciences, under the terms of the Creative Commons Attribution License (https://creativecommons.org/licenses/by/4.0), which permits unrestricted use, distribution, and reproduction in any medium, provided the original work is properly cited.
This article is published in open access under the Subscribe to Open model. Subscribe to A&A to support open access publication.
1 Introduction
Observations have undoubtedly demonstrated that most massive stars live their lives in binary or higher-order multiple systems (e.g., Abt 1984; Sana et al. 2014; Kobulnicky et al. 2014; Dunstall et al. 2015; Moe & Di Stefano 2017; Offner et al. 2023; Bordier et al. 2024). A majority of those stars interact with their companion at some point of their evolution (Sana et al. 2012). This drastically changes the evolutionary path of both binary components, and implies that there should be a large number of post-interaction systems that, depending on the interaction pathway they undergo (stable or unstable mass transfer, or merger), have different orbital and physical characteristics and probe different interaction physics (e.g., Paczyński 1967; Podsiadlowski et al. 1992; Wellstein et al. 2001; Langer 2012; de Mink et al. 2014; De Marco & Izzard 2017; Eldridge & Stanway 2022). Given the large uncertainties that binary evolution is still subject to, detecting and characterizing more post-interaction binaries yields crucial new constraints that will help improve our understanding (e.g., Marchant & Bodensteiner 2024; Chen et al. 2024).
However, the characteristics of interaction products, and how to tell them apart from stars that truly evolve as isolated stars, remain unclear and strongly depend on the type of interaction that may have occurred. In addition to peculiar chemical surface abundances, magnetic fields, or apparent younger ages compared to a reference star or population (e.g., Schneider et al. 2019; Irrgang et al. 2022; Sen et al. 2022; Shenar et al. 2023; Frost et al. 2024), a star’s rotational velocity has been proposed as an important characteristic to distinguish single- and binary-interaction channels. While stars stripped of their hydrogen-rich envelopes are often predicted to be slow rotators (e.g., Kippenhahn & Weigert 1967; Schürmann et al. 2022; Sen et al. 2023), mass gainers are expected to rotate close to or at their critical spin (e.g., Packet 1981; Blaauw 1993; de Mink et al. 2013; Ramírez-Agudelo et al. 2013, 2015; Mahy et al. 2020; Renzo & Götberg 2021).
In this context, classical OBe stars are of interest. These are rapidly rotating, nonradially pulsating, non-supergiant OB-type stars that are surrounded by a circumstellar gaseous decretion disk, causing characteristic emission lines in their spectra (e.g., Rivinius et al. 2013). The origin of the rapid rotation of classical OBe stars is often linked to mass transfer in binary interactions. Theoretical works have shown that the mass gainers in binaries can become rapid rotators (e.g., Pols et al. 1991) and population synthesis computations illustrate that the binary channel can produce a large number of post-interaction rapid rotators that observationally may look similar to OBe stars (Shao & Li 2014, 2021; Wang et al. 2020). However, Hastings et al. (2021) pointed out that the large OBe fraction in star clusters in the Large and Small Magellanic Cloud (LMC, SMC) can only be reproduced assuming that a large fraction of binaries undergo stable mass transfer without merging. Alternatively, the rapid rotation of classical OBe stars is explained by single-star evolution. They may be born as rapid rotators (e.g., Bodenheimer 1995), or efficient angular-momentum transport from the stellar core to the envelope might bring them close to their critical velocity toward the end of the main-sequence (MS) evolution (e.g., Ekström et al. 2012; Hastings et al. 2020). In both single-star scenarios, the multiplicity properties of classical OBe stars are expected to be similar to their OB counterparts, that is, many of them are expected in pre-interaction systems with MS companions (e.g., Sana et al. 2011; Banyard et al. 2022). Contrarily, the binary channel predicts a lack of OBe + MS binaries, and most OBe stars should have stripped or compact companions (e.g., Wang et al. 2024).
Observations in the Milky Way indicate a lack of massive OBe stars in close binary systems with MS companions (Bodensteiner et al. 2020c; Dodd et al. 2024). The detection of post-interaction OBe binaries demonstrates that at least some are indeed interaction products. First, there are OBe binaries with hot-subdwarf O and B (sdOB; e.g., Heber 2009) companions. Those are mostly detected in the UV (e.g., Gies et al. 1998; Koubský et al. 2012; Wang et al. 2021, 2023), or recently also using interferometry (e.g., Klement et al. 2022, 2024). Secondly, some Be binaries further in their evolution have compact companions. In those Be X-ray binaries (BeXRBs), transient X-ray emission can occur when the compact object – usually a neutron star (NS) – periodically moves through the disk of the Be star during the course of its orbit (e.g., Reig 2011; Coe & Kirk 2015; Haberl & Sturm 2016). They can provide important constraints on uncertain binary physics, such as the mass transfer stability and efficiency (e.g., Vinciguerra et al. 2020; Rocha et al. 2024). Some single OBe stars were also interpreted as products of binary interaction, in which the binary system was disrupted in the supernova explosion of the mass donor (e.g., Boubert & Evans 2018; Neuhäuser et al. 2020; Renzo & Götberg 2021). Recently, another group of post-interaction Be binaries in a phase relatively soon after the mass transfer phase was proposed (with LB-1 and HR 6819 as proto-types, Shenar et al. 2020; Bodensteiner et al. 2020b; El-Badry & Quataert 2020; Frost et al. 2022). These systems are detected as double-lined spectroscopic binaries (SB2s). The (partially or fully) stripped donor is thermally relaxing, and thus still large and over-luminous for its mass. It is typically cooler than an sdOB star and, due to its slow rotation, can be detected based on narrow absorption lines in the spectrum. The rapidly rotating mass gainer is often only detected initially due to OBe-typical emission lines arising in the circumstellar disk. Recently, three such systems were reported in the Small Magellanic Cloud (SMC; Ramachandran et al. 2023, 2024).
Overall, only few post-interaction Be-binary systems have been detected, and even less have a fully characterized set of orbital and stellar parameters (see Wang et al. 2023, for an overview of Be+sdOB binaries). Reasons for this are on the one hand, it is difficult to identify such systems observationally, in particular the Be + sdOBs, in which the sdOB components are optically faint and contribute little to the overall flux (e.g., Götberg et al. 2018). Given their masses below 1 M⊙, they only induce small radial-velocity (RV) variations on the more massive Be companion. On the other hand, the Be phenomenon is known to be transient, with emission lines appearing and disappearing on timescales of months, years, and decades (e.g., Townsend et al. 2004), so not all of these objects might show the characteristic OBe emission. Indeed, several binary systems were reported to contain a recently stripped star, in which the mass gainer shows no emission lines typical for OBe stars, for example NGC 1850 BH1 (e.g., Saracino et al. 2022; El-Badry & Burdge 2022; Saracino et al. 2023) and VFTS 291 (Villaseñor et al. 2023) in the LMC, and AzV 476 (Pauli et al. 2022) in the SMC.
Observationally, classical OBe stars can be confused with other objects that have a similar signature but a different physical nature (e.g., Rivinius et al. 2013). More generally, OBe stars are defined as OB stars that show (or have shown) emission lines in their spectra. These include classical OBe stars, but also other objects such as magnetic stars, interacting binaries with an accretion disk causing the emission (e.g., Kříž & Harmanec 1975), supergiants that show emission lines due to their stellar winds, or young stellar objects.
With a metallicity (Z) of 0.2 solar (e.g., Russell & Dopita 1990), the SMC is a prime target for investigating OBe stars, as stellar winds are expected to be weaker and stars spin-down less easily (e.g., Vink et al. 2001; Langer 2012; Smith 2014). Schootemeijer et al. (2022) reported the SMC to host a higher fraction of OBe stars (fOBe ∼ 31%) than what is observed in our Galaxy and the LMC (see also Vieira et al. 2021). The OBe fractions are especially higher in clusters, reaching ∼40% (e.g., Grebel et al. 1992; Iqbal & Keller 2013). There are also many BeXRBs in the SMC (Coe & Kirk 2015; Haberl & Sturm 2016; McBride et al. 2017), outnumbering those reported in the LMC, despite the LMC having a larger population of (massive) stars (Antoniou & Zezas 2016).
This paper is part of a series investigating the multiplicity properties of massive stars across the SMC observed in the Binarity at LOw Metallicity (BLOeM) survey. BLOeM is a multi-epoch spectroscopic survey of almost 1000 massive stars, described in detail in Shenar et al. (2024, hereafter Paper I). Here, we focus on the 82 OBe stars observed in BLOeM. This is not only the largest homogeneous spectroscopic dataset of OBe stars, especially at low Z, but also allows for a direct comparison to the BLOeM OB stars. This manuscript is organized as follows: we briefly summarize the sample selection and observations in Sect. 2, and describe the RV measurements and binary classification criteria in Sect. 3. The observed binary fractions of OBe stars in BLOeM are presented in Sect. 4, and discussed and compared to other BLOeM subsamples and previous works in Sect. 5. We summarize the results and conclude with Sect. 6.
2 BLOeM sample selection and observations
The BLOeM survey uses the FLAMES multi-object instrument at the VLT in Paranal, Chile, with the GIRAFFE échelle spectrograph (Pasquini et al. 2002), allowing for a simultaneous observation of almost 130 stars per field. Covering eight fields over the SMC, 929 stars were observed. After ESO Period P112, nine epochs are available that were taken over the course of approximately four months (September to December 2023). Those were spread unevenly, with a minimum time of one day between the observations, resulting in the eight fields having different time samplings. Due to technical issues with fibers, a handful of stars could only be observed four times.
The BLOeM targets are, by design, selected without any prior knowledge of their types. To ensure the observation of massive stars, targets are chosen based on their Gaia DR3 (Gaia Collaboration 2023) magnitudes and colors in comparison to evolutionary tracks from the extended grid of Schootemeijer et al. (2019) with mass-dependent overshooting and SMC metallicity (described in Appendix B of Hastings et al. 2021). In particular, objects were selected that should have initial masses above 8 M⊙ (Fig. 6). Foreground objects were removed based on their Gaia distances and proper motions. Stars in clusters and other crowded regions that FLAMES cannot resolve were avoided. Apart from the technical limitations of the spectrograph and the fibre allocation (i.e., the minimum distance between two objects to be able to allocate fibers), only the star’s magnitude and no additional information went into our target selection.
All observations are reduced, sky corrected and normalized following the same automated procedure. The final products after data reduction are 1D normalized, sky-subtracted spectra covering the wavelength range 3960 to 4565 Å for each epoch. The resolving power of the given FLAMES setup is approximately 6000, and the individual spectra have typical signal-to-noise ratios (S/Ns) of 50 per pixel, with a few spectra with S/Ns of only around 25, and others above 100. We refer to Paper I for a more detailed description of the target selection, the observations and data reduction, as well as an observing log for each of the fields.
Here, we focus on the 82 OBe stars in the BLOeM sample of 929 stars in total. The total fraction of OBe stars in BLOeM is 11% (including the extra eight stars with large Hα EWs in Gaia). Dividing by spectral types, the Oe star fraction is 13% while the Be fraction is 10%. Their spectral identification is described in detail in Paper I. In short: they were identified in the BLOeM sample based on emission lines in their spectra, mainly in the Balmer lines Hγ and Hδ (Hϵ is at the edge of the wavelength coverage and often not usable). To cross-check, in Paper I, we also investigated the Gaia low-resolution spectra for all stars (not only the ones classified as OBe), which cover the Hα line that is commonly the strongest emission line in OBe spectra. Eight nonsupergiant stars have significantly large Hα equivalent widths (EWs) (indicative of emission, see figure 9 in Paper I) but do not show emission in the BLOeM spectra. Given the low number, and to ensure the usage of a consistent dataset, we here only investigate the stars identified as OBe stars in BLOeM.
To minimize contamination of the OBe sample, we visually investigated Digitized Sky Survey (DSS)-red images for the presence of large-scale nebulosities. The intrinsically narrow but instrumentally broadened nebular emission lines can mimic the spectrum of OBe stars in medium-resolution spectroscopy. Objects in regions with dense nebulosities, or objects that only show weak, narrow emission lines, were thus classified as contaminated by nebulae (“neb”). While some objects might still be misclassified as OBe stars, others might be missed due to the transient nature of the Be phenomenon. Our sample of OBe stars is thus most likely not complete and more OBe stars might be detected or removed from the sample with more observations, in particular covering Hα. Because of their rapid rotation and an infrared excess caused by the cooler circumstellar disk, OBe stars are known to have redder colors than their OB counterparts. Given the target selection based on evolutionary tracks, especially at the faint end of the sample, redder OBe stars were not observed due to the color cut (see also Appendix C).
Figure 1 provides an overview of the spectral types and luminosity classes of OBe stars, as reported in Paper I. Most targets are formally classified as luminosity class II, however, we note that the luminosity-class definition for OBe stars is generally difficult as important diagnostic lines are often contaminated, or even fully dominated by emission infilling. While a majority of the OBe sample are B-type stars (62 objects), there are also 20 O-type stars in the sample. This number is large compared to the few Oe stars known in the Galaxy (e.g., in the BeSS database; Neiner et al. 2011). There seem to be two peaks in the spectral type distribution: one around O9.7, and another one at B2. While the first peak resembles the one reported by Golden-Marx et al. (2016) based on the RIOTS survey (Lamb et al. 2016) in the SMC, the peak in spectral types around B2 agrees with previous findings of OBe stars (e.g., Neiner et al. 2011), and BeXRBs in the Galaxy, the SMC and the LMC (e.g., Maravelias et al. 2014).
Two of the targets with the earliest spectral type, BLOeM 2104 and BLOeM 4-039, were classified as ‘Of?p’ stars in Paper I (they appear without luminosity class in Fig. 1). As all Galactic Of?p stars are strongly magnetic (e.g., Walborn 1972; Nazé et al. 2010; Grunhut et al. 2017; Keszthelyi 2023), they are most likely not classical OBe stars. They are included in this sample as they show emission in their spectra, however, they are not included in the OBe binary statistics (Sect. 4.1) and their binary status is discussed separately. An example single-epoch spectrum of three OBe stars and one Of?p star is shown in Fig. 2.
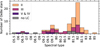 |
Fig. 1 Distribution of spectral types in the OBe sample. The color indicates the assigned luminosity class of the stars (‘V’ and ‘IV’ in purple, ‘III’ in violet, ‘II’ in ocher, and stars without classification in gray). |
3 Binary classification
3.1 Radial velocity measurement
To assess the radial velocities (RVs) of our OBe sample, we use the cross-correlation method (CCF; Zucker 2003), which has previously been applied to OBe stars successfully (e.g., Bodensteiner et al. 2020b; Janssens et al. 2023, Janssens et al. in prep.). We follow a two-step process: first, the highest S/N spectrum is used as the CCF template to measure RVs of each epoch. Each spectrum is then shifted to the same reference frame, and a new co-added template spectrum is produced. In a second step, this higher-S/N template is used as new template for the CCF. The measured RVs are thus not absolute RVs, but relative to the template spectrum, which differs from object to object. Patrick et al. (2025) investigate the overall stability of the wavelength calibration in the BLOeM dataset using the late-type supergiants, which provide a large number of spectral lines for accurate RV determination. They find it to be stable within a few tens of km s−1, which is lower than typical errors measured for the OBe stars.
One assumption of the CCF is that the spectra show no intrinsic variability apart from a shift in wavelength. While the photospheric absorption lines might be impacted by intrinsic stellar variability such as pulsations (see review by Bowman 2020), the emission lines in OBe stars trace disk variability. In case of variability of the star or the disk, the formal errors on the RVs measured may be underestimated (Janssens et al., in prep.). One object, namely BLOeM 6-034, shows clear signatures of being an SB2. Because of the large changes in the line shape, the CCF is not reliable and we measure the RVs by simultaneously fitting two Gaussian profiles to the spectra (see e.g., Sana et al. 2013). More information about this target is given in Appendix E.
Generally, we employ two sets of spectral lines: first, we use all available absorption lines that are not impacted by emission. As the affected lines and the degree of infilling varies from star to star, we visually inspect the individual spectra and select emission-free lines. The main lines used here are He I lines at λλ4009, 4026, 4121, 4144, 4388, and 4471 Å. For the O- and B0 stars, we also use the He II lines at λλ4200 and 4542 Å (which are generally the least affected by the disk). In most stars, metal lines are too weak to provide reliable constraints. One exception is BLOeM 5-071, for which we measure RVs from the strong, narrow Si IV absorption line at λ4088 Å.
Secondly, we use Balmer emission lines (mainly Hγ, but sometimes also Hδ) to independently constrain the RVs of all objects with significant emission. Those measurements likely suffer from larger uncertainties as emission lines are intrinsically variable, which is not taken into account by the CCF. Still the emission lines have important advantages. The profiles are sharper, and generally have a higher S/N compared to the broad, shallow absorption lines. They are also less susceptible to stellar pulsations. In classical OBe stars, emission lines are thought to arise in the circumstellar disk. They thus trace the motion of the star generating the disk and help determine whether the absorption lines in the spectra are formed in the same star. In particular in Be binaries with recently stripped companions (see Sect. 1), the emission lines commonly do not follow the narrow absorption lines, indicating that there are two luminous stars present.
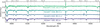 |
Fig. 2 Spectra of four BLOeM emission-line stars, from top to bottom BLOem 2-104 (an Of?p stars with spectral type O5.5 f?pe), BLOeM 7-038 (with only weak emission infilling in the wings of the Balmer lines), BLOeM 4-002 (a B1.5: e star with broad absorption lines), and BLOeM 7-082 (a B2 e+ star with narrow absorption lines and strong double-peaked Balmer emission). |
3.2 Binary criteria
To distinguish binaries from RV-stable objects in a homogeneous way, we use the same binary criteria recently applied to massive stars in the literature (e.g., Sana et al. 2013; Dunstall et al. 2015; Bodensteiner et al. 2020a; Banyard et al. 2022; Mahy et al. 2022). To be classified as binary, at least two individual epochs i and j have to simultaneously satisfy the following two criteria: 1) the difference in RVs measured in the two epochs (ΔRVij) must exceed 4σRVij, and 2) the RV variation ΔRVij must exceed a given threshold RVcrit. Following previous works, and to be consistent with the analysis of O- and B-type stars in BLOeM (see Sana et al. 2025; Villaseñor et al. 2025), we choose a conservative threshold value of 20 km s−1. This criterion is designed to minimize contamination by objects that appear RV variable due to other causes like stellar winds or pulsations. Stars that do not fulfill both criteria are classified as RV-stable (referred apparently single below). Those could either be truly single, or they are undetected binaries with either longer periods than the observing campaign, high eccentricity, or RV variations below the threshold of 20 km s−1 including RV variables seen near pole-on. Indeed, several Galactic Be binaries with stripped companions have RV amplitudes below this conservative threshold (see e.g., Wang et al. 2023, for a recent compilation).
Adopting different values RVcrit, we find that the observed binary fraction does not strongly depend on the chosen RVcrit = 20 km s−1 (Appendix A). OBe stars might be more likely to exceed this simple threshold as they to pulsate (e.g., Rivinius et al. 2013; Labadie-Bartz et al. 2022). This can cause line profile variations and mimic RV shifts of typically up to 20 km s−1. We thus carefully inspect all measured RVs visually and search for indications of line-profile variability typical of pulsations (where, usually, the core of the line is variable, but the wings are stable, Aerts et al. 2009) and flag uncertain cases as such.
3.3 Double-lined spectroscopic binaries
In addition to the aforementioned binary criteria, we visually inspect the spectra and measured RVs for SB2 signatures. SB2s are usually defined as stars where two stellar components are visible in the spectra that move in antiphase with each other. BLOeM 6-034 (also fulfilling both RV criteria) is the only object that clearly shows this.
Six additional objects show a similar signature. Their absorption lines move in antiphase with the emission lines while no second stellar component can be discerned. As the emission lines in antiphase indirectly indicate the presence of a secondary, we soften the standard SB2 definition and classify those as such. Two of them (BLOeM 3-031 and BLOeM 5-071) were already detected as SB2 in Paper I. Five of the six targets also fulfill both binary criteria, while BLOeM 2-111 is only classified as binary because of the SB2 classification (the measured ΔRVmax = 7 ± 3 km s−1 is below the threshold).
3.4 Additional data
Binaries can be classified by means other than spectroscopy. Paper I provides a cross-match of the BLOeM dataset with the OGLE catalog of photometrically variable stars for the SMC (Pawlak et al. 2016), indicating eclipsing binaries (EB) and ellipsoidal variables, as well as with common X-ray catalogs. Here, we discuss the OBe stars among those.
Three stars (BLOeM 3-018, BLOeM 3-031, BLOeM 6-034) are detected as eclipsing binaries in Pawlak et al. (2016). According to the OGLE catalog, BLOeM 3-018 (OGLE-SMC-ECL6595) shows ellipsoidal variability with a period of 1.44 d. We classify it as RV-stable in BLOeM (neither of the two criteria are fulfilled), which could be the case if the two sets of spectral lines never deblend. We thus consider it as apparently single in the following. BLOeM 3-031 (OGLE-SMC-ECL-1232) and BLOeM 6-034 (OGLE-SMC-ECL-5838) are classified as “detached or semi-detached” systems with periods of 4.37 d and 6.43 d, respectively. Using the OGLE orbital parameters, and estimating the RV semi-amplitudes from the BLOeM data, we find that the RVs of BLOeM 3-031 match the OGLE orbit. For BLOeM 6-034, we find a decent match assuming half the OGLE period (see Appendix B). The short periods as well as the light curves illustrate that both systems are most likely semi-detached, interacting binaries and not classical OBe stars. They will thus be removed from the OBe binary fraction.
In Paper I, we also cross-matched the BLOeM targets with several catalogs of known X-Ray sources. Four OBe stars (BLOeM 2-055, BLOeM 2-082, BLOeM 4-026, and BLOeM 4-113) spatially coincide with high-mass X-Ray binaries (HMXBs), making them potential BeXRBs. Only BLOeM 2-082 fulfills both binary criteria and is classified as binary. BLOeM 4-113 is classified as candidate binary as the measured RVs do not exceed the 20 km s−1 threshold. BLOeM 2-055 and BLOeM 4-026 show no statistically significant RV variations, and are classified as RV-stable. For now, we stick with the BLOeM binarity classification of these objects, and only count BLOeM 2-082 as binary in the binary fraction (see below).
4 Results
In the previous section, we investigated the binary properties of all 82 OBe stars based on their RV variations, including additional data when available. We discuss the individual (candidate) binaries and give their RV curves and spectra at RV extremes in Appendices E and F. In the upcoming section, we provide the binary statistics of the 78 stars still counting as classical OBe stars, setting aside the two Of?p stars (both with stable RVs) as well as the two stars classified as semi-detached systems based on OGLE photometry and RV behavior.
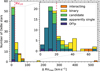 |
Fig. 3 Maximum RV amplitude for all sample stars, with a zoom-in around lower RVs. Apparently single stars are shown in blue, binary candidates in green and binaries in yellow. Also indicated are the two Of?p stars (dark blue) and the two interacting binaries (orange). Both components of the SB2 BLOeM 6-034 are included. Our RV threshold RVcrit = 20 km s−1 is given by red dotted lines. |
4.1 OBe binary fraction
Based on the introduced binary classification, we detect 14 binaries (13 from the RV criteria, and one SB2) among the 78 remaining OBe stars. We further find 11 candidate binaries that fulfill one of the two criteria, and passed our visual inspection as potential binaries. The remaining 53 stars are found to be RV stable and will be referred to as apparently single. The observed binary fraction of the OBe sample is 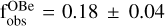 , with the error given from binomial statistics.
Among the 14 systems classified as binaries, we find different behaviors of absorption and emission lines. In two objects, (BLOeM 1-040 and BLOeM 2-109), the emission and absorption lines follow a similar RV trend and no other component is visible (making them SB1s). In three objects, the emission lines remain stationary (BLOeM 5-069, BLOeM 5-071, BLOeM 7-013), while in four objects they appear to move in antiphase to the absorption lines (BLOeM 1-113, BLOeM 2-021, BLOeM 2-111, BLOeM 7-082). Four objects show no clear trend (BLOeM 2-066, BLOeM 2-082, BLOeM 6-001, BLOeM 7-045). In one object (BLOeM7-114), the Balmer emission was too weak to measure RVs from the emission lines and only the absorption-line measurement is available. We discuss potential natures of these objects in Sect. 4.2.
Eleven additional objects are classified as candidate binaries. Either their maximum RV amplitudes are just below the 20 km s−1 threshold but showed a continuous trend over time (as expected in a binary system, e.g., BLOeM 5-035), or a pair of RVs satisfies both aforementioned criteria but visual inspection raised doubts that the object is indeed a binary system (e.g., BLOeM 8-059). Additionally, in some cases, the binary status is only indicated by the RVs measured from the emission lines, while the absorption lines show no significant signal (e.g., BLOeM 4-113). The extra observations that will be secured with BLOeM will help classify these uncertain cases. Assuming all these candidates are indeed binaries increases the observed binary fraction to  .
.
The measured maximum RV amplitudes of all objects are shown in Fig. 3, also indicating the binary classification. Here, we also include the two Of?p stars, and the two objects classified as interacting binaries (for the SB2, we provide RVs for the primary and secondary), one of which stands out immediately due to the very high maximum RV amplitude of over 500 km s−1 (BLOeM 3-031). Similarly, with an RV amplitude of roughly 175 km s−1 BLOeM 5-071 stands out, which is another potential SB2 system. The other stars classified as binaries show RV amplitudes ΔRVmax between 20 km s−1 (by definition) and 65 km s−1. The binary candidates have maximum RV amplitudes between 10 and 35 km s−1, with the low-amplitudes ones being classified as candidates due to a binary-like RV curve. Apart from one clear outlier (with ΔRVmax > 65 km s−1), the maximum RV amplitudes of the stars classified as “RV constant” peak around 10 km s−1 with a few objects having RV amplitudes up to 40 km s−1. These have noisy spectra and typically broad absorption lines, and thus the measured RVs have large error bars on the order of the RV differences. They do not fulfill the significance criterion and show no trend that might indicate binarity. Some objects show RV variations below 5 km s−1, indicating that they are stable in terms of RVs but also show no other strong variability caused, for example, by pulsations.
Figure 4 shows the distribution of binaries and binary candidates over the different fields in the SMC. Overall, field 6 has a surprisingly low number of OBe stars, one of which is the interacting binary BLOeM 6-034. While most binaries are detected in fields 2 and 7, the only binary detected in field 3 is the second interacting binary. Given the overall low number of objects per field, however, the error bars on the respective binary fractions are large and no clear spatial trend across the SMC can be seen. We will re-investigate potential spatial differences, which might also be rooted in a difference in stellar masses and ages across the fields, in future work.
Figure 5 shows the distribution of spectral types of the sample, now classified as apparently single, candidates binaries and binaries, with the two interacting binaries and Of?p stars also indicated. It illustrates that binaries are detected among both Oe and Be stars, with observed binary fractions of  and
and  , respectively. Those agree within the errors. As the Oe sample is relatively small (only 18 objects) the binomial uncertainty is fairly large. Notably, there are no binaries detected among the earliest spectral types (two of which are the Of?p stars). As the star with the latest spectral type, BLOeM 2-097 (B5 II:e), is classified as candidate binary, the spectral classification might be affected.
Figure 6 shows the location of the OBe sample and the stars classified as binary, candidate binary, and RV constant, in the color-magnitude diagram (CMD) constructed from Gaia BPRP colors and G-band magnitudes (Gaia Collaboration 2023). Overlaid are single-star evolutionary tracks from Schootemeijer et al. (2019) and adapted by Hastings et al. (2021), adjusted for the SMC distance (62 kpc; Graczyk et al. 2020) and average extinction (assuming a reddening of EBP−RP = 0.14 mag and an extinction of AG = 0.28 mag, Schootemeijer et al. 2021). In general, OBe stars mostly avoid the region around the zero-age-main-sequence (ZAMS) and are located toward or beyond the terminal-age main-sequence compared to the evolutionary tracks. Compared to the overall BLOeM sample, they are redder than their non-emission counterparts, which could be caused by a combination of the rapid rotation and a contribution of their cooler disks. Fig. 6 further shows that detected binaries and candidates are generally spread across the entire region populated by OBe stars in terms of color and brightness. However, there is a notable lack of detected binaries among the most massive stars in the sample, corresponding to the earliest spectral types.
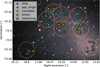 |
Fig. 4 Location of detected binaries (yellow stars), binary candidates (green diamonds), and apparently single stars (blue circles) across the eight fields (dotted orange circles). Also indicated are the two Of?p stars (dark blue circles) and the two interacting binaries (orange stars). The background is a false-color (Y-J-KS) image from VISTA (ESO/VISTA VMC, Cioni et al. 2011). |
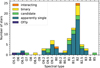 |
Fig. 5 Binary statistics as a function of spectral type (see also Fig. 1). The color coding is the same as in Fig. 4. |
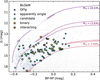 |
Fig. 6 Binary statistics in the Gaia CMD (same color coding as Fig. 4). Over-plotted is the BLOeM sample (blue dots, Paper I), all Gaia sources from which the sample was selected (gray dots), and evolutionary tracks from the extension of the grid of Schootemeijer et al. (2019) with initial masses as indicated. |
4.2 Potential nature of detected binaries
As mentioned in Sect. 4.1, part of our detected OBe binaries have an SB1 signature, in which absorption and emission lines follow the same RV trend (BLOeM 1-040 and BLOeM 2-109). In other systems, the absorption lines move in antiphase with the emission lines (four objects), or the emission lines appear stationary over moving absorption lines (three objects). We assign these three possibilities as Class 1, 2 and 3, respectively, and discuss them here in more detail.
Class 1 – SB1 OBe binaries: In the systems classified as SB1 (BLOeM 1-040 and BLOeM 2-109), the emission traces the absorption lines and no additional component is visible. We postulate that the double-peaked emission arises in a circumstellar disk around the same object that produces the absorption lines, the OBe star. The companion could be a low-mass MS star, or an optically faint object, such as a stripped star, a NS, or a black hole (BH). While unlikely, is can currently also not be excluded that the companion is a similarly bright, rapid rotator with broad lines difficult to discern in the complicated spectra. Both systems show RV variability with timescales on the order of the observing period, that is around two months. To explain the relatively large RV amplitudes with such an orbital period, in particular in the case of BLOeM 2-109, a fairly massive object must be present.
Class 2–SB2 OBe + absorption-line companions: In four objects, namely BLOeM 1-113, BLOeM 2-021, BLOeM 2-111, and BLOeM7-082, we find that the absorption and emission lines move in antiphase with each other. Such a signature can have two potential causes. The emission lines could be stationary, and the moving absorption lines can induce an apparent motion of the emission lines (Abdul-Masih et al. 2020; El-Badry & Quataert 2020). A stationary emission line could for example be caused by a nebulosity or a circumbinary disk (which has so far not been detected in massive binary systems, and is most likely hard to sustain in massive binaries, Izzard & Jermyn 2023). Furthermore, the large RV amplitudes measured in those systems make this an unlikely interpretation. The same signature can also arise when two stars, causing the absorption and emission lines, are truly moving in antiphase. These again can be subdivided into two separate cases: those containing “true” classical OBe stars, and those containing other emission-line objects. The latter could for example be interacting binary systems such as the two interacting binaries detected here in BLOeM, where the emission arises in a disk around the accreting star. Such objects can be misclassified as OBe stars, and are usually short-period systems that show a photometric signature of binarity as well (Waelkens 1991), similar to BLOeM 3-031 and BLOeM 6-034. On the other hand, systems with antiphase RVs could contain classical OBe stars with a luminous companion. The systems could either be pre-interaction binaries with OBe stars and MS companions, which so far have not been detected. In this case the OBe stars would be formed through a single-star channel. Alternatively, they could be post-interaction binaries in which both the mass gainer (the OBe component) and the stripped mass donor, are similarly bright (see below). The determination of the orbital period of these systems will help in understanding their nature, especially if they contain a classical OBe star or not.
Class 3 – stationary emission + absorption-line binary: In three objects (BLOeM 5-069, BLOeM 5-071, BLOeM 7-013), the absorption lines show large RV amplitudes as in an SB1 binary, while the emission lines are basically stationary. In BLOeM 5-071, the narrow absorption lines move with large RV amplitudes of ΔRVmax ∼ 175 km s−1. In BLOeM 5-069, the emission component is difficult to measure as there is a central narrow absorption component which could indicate an OBe star viewed edge-on. Those systems also show the signature of two individual components, a star as well as a potential disk. A similar signature was recently observed in post-interaction binaries just after mass transfer such as LB-1 and HR 6819 (e.g., Abdul-Masih et al. 2020; Shenar et al. 2020; Bodensteiner et al. 2020b; El-Badry & Quataert 2020). This initially led to their mis-classification as systems containing BHs. Contrary, such a signature could be caused by a truly stationary emission source such as a nebulosity, a circumbinary disk, or a massive unseen object like a BH surrounded by an accretion disk (as the initial interpretation of LB-1 proposed). The analysis of future epochs will tell if the emission lines are indeed stationary, shedding light on their nature.
5 Discussion
5.1 Observational biases
The observed binary fraction of a population of stars can in principle be corrected for observational biases to obtain an intrinsic, bias corrected fraction (see e.g., Sana et al. 2012; Sana et al. 2013; Kiminki & Kobulnicky 2012). This requires knowledge of the expected distribution of orbital parameters of the binary systems (most importantly the periods and mass ratios) or these need to be constrained simultaneously during the bias correction process. Given that these distributions were measured for pre-interaction systems and might be mass and metallicity independent (see e.g., Almeida et al. 2017; Villaseñor et al. 2021; Banyard et al. 2022), populations of pre-interaction binaries such as the OB stars in BLOeM can be corrected for observational biases in a straight-forward manner (see Sana et al. 2025; Villaseñor et al. 2025).
OBe stars, however, are interpreted as a population dominated by binary interaction products. Therefore, the preinteraction distributions usually used in the bias correction are not valid here. The distributions of periods and mass ratios for post-interaction systems are not observationally constrained (yet). One possibility would be to use binary population synthesis models starting from the observed pre-interaction binaries and computing their evolution. However, there are still many uncertainties in the binary interaction physics, the assumption on supernova kicks, as well as which simulated stars would appear as OBe stars observationally. This implies that the simulations should be treated with great care and we therefore refrain from providing a formal bias correction here.
To nevertheless evaluate the types of binary systems that would be detectable, we simulate the detection probability of the BLOeM OBe survey for an illustrative 10 M⊙ Be primary and a range of orbital periods (P) from 1 day to ∼ 10 years and mass ratios (q = M2/MBe) from 0.01 to 1. We simulate 10 000 BLOeM-like observing campaigns of Be stars. We randomly draw the eccentricity of the system from a flat eccentricity distribution between 0 and 0.9, assume a random orientation of the orbit in 3D space, and adopt a random time of periastron passage. We further assume typical errors of 5 km s−1 and adopt the temporal sampling of the observations of OBe stars in BLOeM. We finally adopt the same binary detection criteria as described in Sect. 3 and evaluate the detection probability in the P–q plane.
The results in Fig. 7 are independent of the underlying distributions of periods and mass-ratios and only weakly depend on assumptions on the eccentricity (e.g., Sana et al. 2013). Here, we also show known detected OBe binaries. Those include systems with sdOB companions, which are mostly detected and characterised using far-UV spectroscopy (see Wang et al. 2023, for a recent overview) or interferometry (Klement et al. 2024). We also include so-called γ Cas-like binaries listed in Wang et al. (2023) for which the nature of the companion is still debated (see also Nazé et al. 2022). Finally, we plot OBe binaries with recently stripped companions: LB-1 (Shenar et al. 2020), HR 6819 (Bodensteiner et al. 2020b), two systems from Ramachandran et al. (2024, namely 2dFS 2553 and Sk-71 35), and AzV 476 from Pauli et al. (2022). Also indicated are the mass ratio range covered by typical Be+NS systems, assuming a 10 M⊙ Be star and NS companion masses between 1.4 and 3.0 M⊙, and a 10 M⊙ Be star with a BH companion of 8 M⊙.
The simulations in Fig. 7 show that our observational setup is sensitive to short-period systems of almost all mass ratios up to observing periods of about 3 months (approx. the duration of the observing campaign). It drops strongly for longer periods, and most systems with periods above 300 d would not be detected with the given setup. While the detection probability does not vary strongly with mass ratio above q = 0.2 in this period range, small mass ratios (q < 0.05) are unlikely to be detected at any period due to the low reflex motion induced on the Be star. We repeated the same simulations for a 7 M⊙ primary Be star and find similar results. This is to be expected as they are not sensitive to the assumed primary mass (but on the mass ratio).
This numerical experiment demonstrates that the current observational campaign would have allowed us to detect OBe+MS binaries with mass ratios above 0.2 and periods below 100 days. Those are expected to exist abundantly if OBe stars had similar binary properties than OB-type stars (see also next section). Furthermore, OBe binaries with BH companions, which are predicted by binary population synthesis based on dense grids of detailed binary evolution models (e.g., Langer et al. 2020, Xu et al. in prep.) would have been detected. Their lower-mass counterparts, NS companions, can be detected with a probability >90% if their periods are below ∼ 30 days. NS binaries with longer periods are unlikely detected as such, which can explain why two HMXBs appear as apparently single stars based on our RV campaign. Systems with even lower mass ratios, like sdOB or white dwarf binaries, cannot be detected with the given setup. The overall low observed binary fraction of the OBe sample thus indicates that there are few OBe+MS systems, and suggests that OBe stars mostly have stripped companions (see e.g., Wang et al. 2024). Some of the binary systems detected here, in particular the SB1s, may be OBe+NS or OBe+BH systems.
As mentioned in Sect. 2, we recall here that our sample of OBe stars is incomplete. First, as described in Paper I, given the observing strategy, the overall sample is incomplete in terms of massive stars. Notably, already the avoidance of crowded regions leads to missing many OBe objects: Dufton et al. (2019) report the presence of 73 Be stars in NGC 346 that could not be observed in BLOeM. Secondly, given the lack of the Hα line in our observing range, which is usually the strongest emission line in OBe stars, stars with the weakest emission are potentially not identified as such in our sample. Thirdly, the transient nature of the Be phenomenon and the short time span covered by the observations lead to an additional incompleteness. On the other hand, several objects might be classified as OBe stars here, even if they are not classical OBe stars by nature.
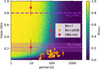 |
Fig. 7 Binary detection probability pdetect as a function of period and mass ratio for a 10 M⊙ Be star. Overplotted are OBe binaries with known periods and mass ratios from Klement et al. (2024) and Wang et al. (2023, Be+sdOBs in orange and Be binaries with companions of uncertain or debated nature in yellow), and recently stripped stars from Shenar et al. (2020), Bodensteiner et al. (2020b), Pauli et al. (2022) and Ramachandran et al. (2024). Overplotted are also lines for potential Be+NS binaries (assuming NS masses between 1.4 and 3 M⊙), and a Be binary with an 8 M⊙BH companion. |
5.2 Comparison to OB stars in BLOeM
The BLOeM survey allows for a direct comparison of the observed binary properties of OBe to OB stars. In particular, these objects are in the same environment, were observed with the same observational setup and timing, and the data were analyzed in a similar way. These alleviate some of the common uncertainties when comparing observed properties of OBe stars with other objects, derived using different observing setups or techniques, or targeting stars located in different environments.
The RV analysis of the 139 O-type stars in BLOeM yields an observed binary fraction of 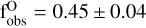 (Sana et al. 2025). The observed binary fraction measured in the 311 early B-type stars with luminosity classes III-V, similar to the stars in this sample, is
  (Villaseñor et al. 2025), and thus agrees with the O-star measurement. The binary fraction of the 78 classical OBe stars of
  is less than half the value measured in OB stars, and thus differs significantly. Even when including all potential candidates (Sect. 4.1), the observed binary fraction of OBe stars of
  remains significantly below that of OB stars.
Also the number of SB2s, which are in most cases preinteraction binaries (de Mink et al. 2014), detected among the OBe stars is much lower than for OB stars. Among the O stars, 22 out of 139 objects were classified as SB2, which is 0.16 ± 0.03 of the sample (Sana et al. 2025). Among the B stars, the SB2 fraction is 0.19 ± 0.02 (59 out of 309, Villaseñor et al. 2025). In the OBe sample, we find that seven of the 78 systems, that is 0.09 ± 0.03, show an SB2-like signature, much lower than the fraction in OB stars. We have softened the SB2 definition here, as we include systems where absorption and emission lines move in antiphase, indicating the presence of a companion star that is surrounded by a circumstellar disk, which is not directly detected. Some of those could also be interacting binaries like BLOeM 3-031 and BLOeM 6-034, and thus no classical OBe stars at all, further reducing the number SB2s.
As discussed in Sect. 3.2, the spectra of OBe stars are impacted by additional variability, which might lead to a misclassification of stable objects as binaries. Contrary, stellar variability could also mask the presence of binary companions, although only the ones with weak signatures. Obvious binaries – those with similar masses, short periods and large RV amplitudes – should have been detected among the OBe stars. Here, however, we find that the observed binary fraction and the number of detected SB2s in OBe stars are significantly lower than the ones measured for their OB counterparts. This implies that the underlying multiplicity properties of OBe stars are different (likely longer orbital periods, or smaller mass ratios, or dimmer companions as would be expected if they are of a different nature than in OB+MS binaries). This is expected if OBe stars are indeed the products of binary interactions.
5.3 Comparison to OBe stars in the SMC
The Runaways and Isolated O-Type Star Spectroscopic Survey of the SMC (RIOTS4, Lamb et al. 2016) targeted almost 400 isolated early-type stars with single- or multi-epoch spectroscopy (the latter for less than 10% of the sample), and found that 42% of their stars are classical OBe stars (Lamb et al. 2016). In particular, they find a large fraction of classical Oe stars, an order of magnitude higher than reported in the Galaxy (Golden-Marx et al. 2016). Dallas et al. (2022) and Phillips et al. (2024) find that OBe stars are more isolated than OB stars, and that their spatial distribution and kinematics is similar to HMXBs. This leads them to interpret OBe stars as likely interaction products.
Only ten targets are in common between RIOTS4 and the OBe sample of BLOeM. The derived spectral types largely agree within one subtype. One object (BLOeM 7-051) did not show emission in RIOTS4 but appears as Be star in BLOeM. Only one BLOeM object (BLOeM 2-082) was included in the multiepoch monitoring of RIOTS4. Based on four available epochs, it was classified as binary in RIOTS4 (Lamb et al. 2016), and is also classified as binary in BLOeM.
Due to technical limitations, the BLOeM survey avoids the dense cores of star clusters, mainly the young cluster NGC 346 with an age below 5 Myr (e.g., Sabbi et al. 2008), and NGC 330 with a age of about 45 Myr (Patrick et al. 2020). Those harbour many massive stars, in particular also OBe stars (e.g., Dufton et al. 2019; Milone et al. 2018; Bodensteiner et al. 2020a), and both were targeted by spectroscopic studies recently.
Dufton et al. (2019) provided a stellar census of NGC 346 based on VLT/FLAMES data of over 250 O- and early-B stars, detecting 70 Be stars among them. The Be star fraction of 0.27 ± 0.03 is thus larger than the one in BLOeM (which amounts to approximately 11%, Shenar et al. 2024). This might be linked to the selection of targets and the incompleteness of the BLOeM OBe sample discussed in Sect. 2. Given that only two to four epochs spanning 40 days or less were available, the detection probability for binaries is low, and no binary fraction for OBe stars was provided (see Dufton et al. 2022).
NGC 330 was studied based on six epochs obtained over the course of approximately 1.5 years with the integral-field spectrograph MUSE at the VLT (Bodensteiner et al. 2020a, 2021, 2023). While covering practically the entire optical wavelength range, MUSE only provides a spectral resolving power between 1700 and 4000, much lower than the FLAMES data used here. Given the age of the cluster, almost no O-type stars are present anymore. Among the roughly 330 B-type stars, 115 show emission lines typical of Be stars, resulting in a Be fraction of fBe = 0.35 ± 0.03, similar to the one measured in NGC 346. Adopting the same binary criteria invoked here, Bodensteiner et al. (2021) derived an observed binary fraction of the Be sample of only  . This is even lower than the fraction derived here, and could be linked to the lower binary detection probability in NGC 330, that comes from the lower resolving power and fewer epochs available. Still, obvious binary systems with large RV amplitudes should have been detected.
5.4 Comparison to HMXBs in the SMC
The SMC is known for its large number of HMXBs, in particular BeXRBs (e.g., Coe & Kirk 2015; Antoniou et al. 2019). However, none of the BeXRBs in Coe & Kirk (2015) and only three sources in Antoniou et al. (2019) overlap with our OBe sample. In addition to those three sources, there is one more HMXBs from other X-ray catalogs (e.g., Evans et al. 2010; Sturm et al. 2013). Only one of those four XRBs are detected as binary in BLOeM, and an additional one as candidate binary (the measured ΔRVmax does not exceed 20 km s−1). If the other two objects are indeed BeXRBs, and not chance alignments between the optical and the X-ray source positions, their companions are most likely lower-mass NSs, or their periods would be longer than the current observing campaign.
Overall, most HMXBs listed in the catalog by Antoniou et al. (2019) and the BeXRBs from Coe & Kirk (2015) are significantly fainter and redder than the majority of the BLOeM sample. Their redder colors place them mostly beyond our color cut based on the 8 M⊙ evolutionary track employed in the target selection. This color bias particularly affects the faint end of the BLOeM sample. This is illustrated in Appendix C, where we compare the samples by Antoniou et al. (2019) and Coe & Kirk (2015) with the BLOeM sample. It demonstrates again the incompleteness of the BLOeM survey for faint, red Be stars, and explains the overall small number of BeXRBs in this large sample of classical OBe stars.
6 Conclusion
In this study, we investigate the binary properties of 82 OBe stars observed in the context of the BLOeM survey. We measured RVs using the CCF technique in nine epochs obtained over the course of almost three months with the FLAMES multi-object spectrograph at the VLT, and searched for RV variations. Both the stellar absorption lines and the emission lines characteristic of these types of objects are investigated. All spectra were visually inspected for signatures of SB2s.
After excluding two Of?p stars and two interacting binaries, we detect fourteen binaries among our 78 Be objects as well as eleven candidate binaries. Considering only the robust detections, we measure an observed binary fraction of the OBe sample in BLOeM of 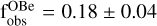 , which is less than half of the observed binary fraction measured for the O and the B stars in BLOeM (Sana et al. 2025; Villaseñor et al. 2025). An estimate of the detection probability of our campaign shows that systems with periods below 100 d and mass ratios above 0.2 would most likely have been detected. The lower binary fraction among OBe stars relative to OB stars is most likely easily explained when assuming OBe stars are post-interaction products.
In some binaries, the RVs measured from emission lines follow the absorption lines, while in others, there seems to be an antiphase motion, or the emission lines appear stationary (see Sect. 4.2). These different signatures imply different properties of the companions. When following the same trend, the emission and absorption lines arise from the same object, and the companion is not detected in the optical. Those could be systems with massive compact object companions, or rapidly rotating MS stars. When moving in antiphase, two visible components are present, a star and the source of the emission lines, which might be an accretion or decretion disk around another star, or a stationary component that could arise from material located around the binary system (a circumbinary disk, or a nebulosity). Those systems could thus either be currently interacting binaries, or recently stripped stars with OBe companions, in which the stripped star is still puffed-up and bright.
Our observing campaign is most sensitive to detecting binaries with periods below 100 d and mass ratios above 0.1. In particular the mass-ratio sensitivity implies that OBe stars with stripped stars or neutron-star companions, that would invoke only small semi-amplitudes in the OBe stars, would mostly appear as apparently single with the given setup. Contrary, we would have detected systems with similar mass-ratio companions in the aforementioned period range. Given the masses considered here, those could either be BHs or massive MS stars. The former are predicted to exist by populations synthesis calculations (e.g., Langer et al. 2020), but are not observed here. The lack of the latter illustrates again the previously reported lack of OBe stars with MS companions.
The additional 16 epochs obtained in the BLOeM survey will allow further constraints on the nature of our detected binaries, particularly the nature of the companions that could either be MS objects (if OBe stars could form as single stars), stripped stars or compact objects. The new observations, which in total cover two years of observing time, will also allow us to detect more Be binaries, especially objects with much longer periods. Detecting additional OBe binaries and constraining their orbital and physical parameters is crucial to further constrain the evolutionary origin of classical OBe stars. If at least part of them turn out to be products of binary interactions, the characterization of additional systems will allow for direct constraints on the physics of the interaction that such systems experienced.
Data availability
Tables C.1 and C.2 are available in electronic form at the CDS via anonymous ftp cdsarc.cds.unistra.fr (130.79.128.5) or via https://cdsarc.cds.unistra.fr/viz-bin/cat/J/A+A/698/A38. Appendices D, E and F are available via https://doi.org/10.5281/zenodo.14679548
Acknowledgements
The research leading to these results has received funding from the European Research Council (ERC) under the European Union’s Horizon 2020 and Horizon Europe research and innovation programme (grant agreement numbers 772225: MULTIPLES, and 945806) and is supported by the Deutsche Forschungsgemeinschaft (DFG, German Research Foundation) under Germany’s Excellence Strategy EXC 2181/1-390900948 (the Heidelberg STRUCTURES Excellence Cluster). DMB gratefully acknowledges funding from UK Research and Innovation (UKRI) in the form of a Frontier Research grant under the UK government’s ERC Horizon Europe funding guarantee (SYMPHONY; grant number: EP/Y031059/1), and a Royal Society University Research Fellowship (URF; grant number: URF\R1\231631). RGI is funded by STFC grant ST/Y002350/1 as part of the BRIDGCE UK network, and thanks IReNA colleagues for stimulating discussions. Z.K. acknowledges support from JSPS Kakenhi Grant-in-Aid for Scientific Research (23K19071). IM acknowledges support from the Australian Research Council (ARC) Centre of Excellence for GravitationalWave Discovery (OzGrav), through project number CE230100016. DP acknowledges financial support by the Deutsches Zentrum für Luft und Raumfahrt (DLR) grant FKZ 50OR2005. DFR is thankful for the support of CAPES-Br and FAPERJ/DSC-10 (SEI-260003/001630/2023). AACS and VR are supported by the German Deutsche Forschungsgemeinschaft (DFG) under Project-ID 445674056 (Emmy Noether Research Group SA4064/1-1, PI Sander). AACS and VR are further supported by funding from the Federal Ministry of Education and Research (BMBF) and the Baden-Württemberg Ministry of Science as part of the Excellence Strategy of the German Federal and State Governments. JIV acknowledges support from the European Research Council for the ERC Advanced Grant 101054731. LRP acknowledges support from grant PID2022-140483NB-C22 funded by MCIN/AEI/10.13039/501100011033. GH acknowledges support from grants PID2021-122397NB-C21/PID2022-136640NB-C22 funded by MCIN/AEI/FEDER/10.13039/501100011033. J.K. thanks for the support of a grant GA CR 22-34467S. This project has received funding from the European Research Council (ERC) under the European Union’s Horizon 2020 research and innovation programme (grant agreement 101164755/METAL) and was supported by the Israel Science Foundation (ISF) under grant number 2434/24.
Appendix A Dependence on the adopted RV threshold
Here, we investigate the impact of the adopted critical RV threshold in the binary criteria on the observed binary fraction. For this, we vary the threshold between 1 and 50 km s−1, and for each threshold value, compute the observed binary fraction according to the criteria laid out in Sect. 3.2. Fig. A.1 shows that the observed binary fraction is consistent within the errors between threshold values of approximately 16 and almost 40 km s−1, and thus not strongly sensitive to the exact value. The observed binary fraction never drops to zero as clear SB2s are flagged as such and always count in the binary fraction, even if they do not fulfill both criteria.
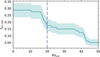 |
Fig. A.1 Observed binary fraction as a function of critical RV threshold value RVcrit. The adopted value of 20 km s−1 is indicated by the blue vertical line. |
Appendix B Orbits for OGLE-variable stars
Three OBe stars are classified as photometrically variable stars in OGLE (Pawlak et al. 2016), namely BLOeM 3-018, BLOeM 3031, and BLOeM 6-034. BLOeM 3-018 is classified as ellipsoidal variable with a period of 1.44 d, but is not detected as binary in BLOeM. We leave its analysis to the availability of additional spectroscopic epochs.
BLOeM 3-031, and BLOeM 6-034 are classified as “detached or semi-detached” system with periods of 4.37 d and 6.43 d. Both are classified as binaries, in particular as SB2s, in this work. As a consistency check, we compare the OGLE orbital parameters (in particular the period P and the epoch of primary eclipse T0) with the measured RVs. The remaining orbital parameters (the RV semi-amplitude K and the systemic velocity γ) are estimated crudely from the observed RV curve, while for simplicity the eccentricity is fixed to zero. Here, we do not perform a detailed fitting but compare if the two orbits match.
BLOeM 3-031: This object (classified as SB2 already in Paper I with B0: III: + OB e) shows a clear SB2 signature with a narrowlined component that is moving with a large RV amplitude of up to 500 km s−1, measured from the strong Si II lines. Additionally, there is a double-peaked emission component that appears to be moving in antiphase, however with a much lower amplitude than the narrow-lined star. Given the emission lines are intrinsically variable in shape and amplitude, we refrain from comparing their RVs here. The spectral signature of this target resembles the post-interaction binary Sk – 71∘ 35 recently detected in the LMC (Ramachandran et al. 2024).
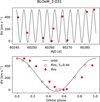 |
Fig. B.1 RV curve of BLOeM 3-031 (filled red dots) with the photometric orbit overplotted (gray), as a function of time (upper panel) and orbital phase (lower panel). In the phase-folded curve we also include the assuming T0 = T0−0.4 days, which provide a much better fit to the data. |
Figure B.1 shows the photometric orbit of BLOeM 3-031 assuming K1 = 275 km s−1 and γ = 250 km s−1, overplotted over the RVs measured from the Si II lines. In the phase-folded RVcurve we also include the RVs at phases shifting the photometric T0 by 0.4 days, to illustrate an even better match. Such deviation would not be surprising given the short period of the system and the observing time difference of roughly 10 years between the two data sets, in which a small error in the period could lead to such an effect. This comparison demonstrates that the spectroscopic and photometric features align and BLOeM 3-031 is indeed an interacting, semi-detached binary.
BLOeM 6-034: BLOeM 6-034 shows the only clear SB2 feature among the sample, with two stellar components moving back and forth in particular visible in the He I lines. Additionally, there seems to be a stable, third component in the emission Balmer lines that leads to line-infilling and a relatively stable Hγ profile. Given the SB2 nature of BLOeM 6-034, for which the CCF (assuming stable line profiles) does not provide reliable RVs, we further employ double-Gaussian fitting (e.g., Sana et al. 2014) to determine the RVs of the object, (see Fig. B.2, both measured from He I lines). Because of the complicated nature of the line profiles, we do not attempt to infer RVs of the putative emission component.
For BLOeM 6-034, the photometric orbit does not match the spectroscopic RVs as well. This object is the only system that shows two sets of absorption lines moving in antiphase, and we estimated both RVs, however, with larger uncertainties (see Sect. 3). As the photometric orbit and the measured RVs did not match, we tried to get a better match using half or twice the OGLE period. Indeed, as illustrated by Fig. B.2, we find a better match using the OGLE T0, half the OGLE period (P′ = 3.21 d), as well as γ = 80 km s−1, K1 = 120 km s−1 and K2 = 300 km s−1. While there is still no ideal match with the RVs of the secondary, the primary RVs align well with the orbit. The discrepancy could be due to problems with the RV measurements, given the highly blended spectral lines. However, the comparison and the even shorter period indicate that BLOeM 6-034 is indeed a semi-detached binary.
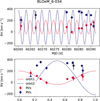 |
Fig. B.2 RV curves of BLOeM 6-034 (red and blue dots, for the two components visible in the spectra) with the photometric orbits overplotted (in matching colors), as a function of time (upper panel) and orbital phase (lower panel). |
Appendix C Comparison to catalogs of HMXBs
Here, we compare the BLOeM OBe sample with catalogs of X-ray sources. We use the catalog of HMXBs by Antoniou et al. (2019), which is based on their Chandra X-ray Visionary Program (XVP) and supplemented by 14 additional HMXBs identified by Haberl & Sturm (2016), and the BeXRB catalog by Coe & Kirk (2015). For this comparison, we cross-match the two catalogs with the Gaia DR3 catalog to obtain positions, BPRP colors and magnitudes in the same reference frame as the BLOeM sources, resulting in 123 sources with the former, and 48 sources in the latter.
Overall, only two BLOeM OBe stars coincide with HMXBs in Antoniou et al. (2019), and there is no overlap with the BeXRBs in Coe & Kirk (2015). The overall sky coverage of the XVP, and the spatial distribution of BeXRBs somewhat align with the BLOeM fields (especially covering fields 2, 3, 4, 6 and 8, see Fig. C.1). A large fraction of detected X-ray sources, however, are outside the BLOeM fields, which might be part of the reason of the low number of matches. Additionally, the BeXRBs and HMXBs in the two catalogs are significantly fainter as well as redder than the targets selected in BLOeM (see Fig. C.2). The selection based on evolutionary tracks excludes a large number of the known X-ray sources, especially the ones with redder color. Those targets could have later spectral types, or larger disks (which then lead to a stronger IR excess making them appear redder). Overall, this explains the low number of BeXRBs in the BLOeM sample.
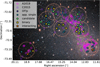 |
Fig. C.1 Same as Fig. 4, with the HHMXBs of Antoniou et al. (2019) and the BeXRBs of Coe & Kirk (2015) indicated in purple and pink, respectively. |
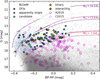 |
Fig. C.2 Same as Fig. 6, but with the HMXBs of Antoniou et al. (2019) and the BeXRBs of Coe & Kirk (2015) overlain in purple and pink, respectively. Note the adopted magnitude cut extending to fainter objects here to show the faintness of the HMXBs in particular in the Antoniou et al. (2019) catalog. |
References
- Abdul-Masih, M., Banyard, G., Bodensteiner, J., et al. 2020, Nature, 580, E11 [Google Scholar]
- Abt, H. A. 1984, ApJ, 285, 247 [Google Scholar]
- Aerts, C., Puls, J., Godart, M., & Dupret, M. A. 2009, A&A, 508, 409 [NASA ADS] [CrossRef] [EDP Sciences] [Google Scholar]
- Almeida, L. A., Sana, H., Taylor, W., et al. 2017, A&A, 598, A84 [NASA ADS] [CrossRef] [EDP Sciences] [Google Scholar]
- Antoniou, V., & Zezas, A. 2016, MNRAS, 459, 528 [Google Scholar]
- Antoniou, V., Zezas, A., Drake, J. J., et al. 2019, ApJ, 887, 20 [NASA ADS] [CrossRef] [Google Scholar]
- Banyard, G., Sana, H., Mahy, L., et al. 2022, A&A, 658, A69 [NASA ADS] [CrossRef] [EDP Sciences] [Google Scholar]
- Blaauw, A. 1993, in Astronomical Society of the Pacific Conference Series, 35, Massive Stars: Their Lives in the Interstellar Medium, eds. J. P. Cassinelli, & E. B. Churchwell, 207 [Google Scholar]
- Bodenheimer, P. 1995, ARA&A, 33, 199 [NASA ADS] [CrossRef] [Google Scholar]
- Bodensteiner, J., Sana, H., Mahy, L., et al. 2020a, A&A, 634, A51 [NASA ADS] [CrossRef] [EDP Sciences] [Google Scholar]
- Bodensteiner, J., Shenar, T., Mahy, L., et al. 2020b, A&A, 641, A43 [NASA ADS] [CrossRef] [EDP Sciences] [Google Scholar]
- Bodensteiner, J., Shenar, T., & Sana, H. 2020c, A&A, 641, A42 [NASA ADS] [CrossRef] [EDP Sciences] [Google Scholar]
- Bodensteiner, J., Sana, H., Wang, C., et al. 2021, A&A, 652, A70 [NASA ADS] [CrossRef] [EDP Sciences] [Google Scholar]
- Bodensteiner, J., Sana, H., Dufton, P. L., et al. 2023, A&A, 680, A32 [NASA ADS] [CrossRef] [EDP Sciences] [Google Scholar]
- Bordier, E., de Wit, W. J., Frost, A. J., et al. 2024, A&A, 681, A85 [NASA ADS] [CrossRef] [EDP Sciences] [Google Scholar]
- Boubert, D., & Evans, N. W. 2018, MNRAS, 477, 5261 [Google Scholar]
- Bowman, D. M. 2020, Front. Astron. Space Sci., 7, 70 [Google Scholar]
- Chen, X., Liu, Z., & Han, Z. 2024, Progr. Part. Nucl. Phys., 134, 104083 [Google Scholar]
- Cioni, M. R. L., Clementini, G., Girardi, L., et al. 2011, A&A, 527, A116 [CrossRef] [EDP Sciences] [Google Scholar]
- Coe, M. J., & Kirk, J. 2015, MNRAS, 452, 969 [NASA ADS] [CrossRef] [Google Scholar]
- Dallas, M. M., Oey, M. S., & Castro, N. 2022, ApJ, 936, 112 [NASA ADS] [CrossRef] [Google Scholar]
- De Marco, O., & Izzard, R. G. 2017, PASA, 34, e001 [Google Scholar]
- de Mink, S. E., Langer, N., Izzard, R. G., Sana, H., & de Koter, A. 2013, ApJ, 764, 166 [Google Scholar]
- de Mink, S. E., Sana, H., Langer, N., Izzard, R. G., & Schneider, F. R. N. 2014, ApJ, 782, 7 [Google Scholar]
- Dodd, J. M., Oudmaijer, R. D., Radley, I. C., Vioque, M., & Frost, A. J. 2024, MNRAS, 527, 3076 [Google Scholar]
- Dufton, P. L., Evans, C. J., Hunter, I., Lennon, D. J., & Schneider, F. R. N. 2019, A&A, 626, A50 [NASA ADS] [CrossRef] [EDP Sciences] [Google Scholar]
- Dufton, P. L., Lennon, D. J., Villaseñor, J. I., et al. 2022, MNRAS, 512, 3331 [NASA ADS] [CrossRef] [Google Scholar]
- Dunstall, P. R., Dufton, P. L., Sana, H., et al. 2015, A&A, 580, A93 [NASA ADS] [CrossRef] [EDP Sciences] [Google Scholar]
- Ekström, S., Georgy, C., Eggenberger, P., et al. 2012, A&A, 537, A146 [Google Scholar]
- El-Badry, K., & Burdge, K. B. 2022, MNRAS, 511, 24 [NASA ADS] [CrossRef] [Google Scholar]
- El-Badry, K., & Quataert, E. 2020, MNRAS, 493, L22 [NASA ADS] [CrossRef] [Google Scholar]
- Eldridge, J. J., & Stanway, E. R. 2022, ARA&A, 60, 455 [NASA ADS] [CrossRef] [Google Scholar]
- Evans, I. N., Primini, F. A., Glotfelty, K. J., et al. 2010, ApJS, 189, 37 [NASA ADS] [CrossRef] [Google Scholar]
- Frost, A. J., Bodensteiner, J., Rivinius, T., et al. 2022, A&A, 659, L3 [NASA ADS] [CrossRef] [EDP Sciences] [Google Scholar]
- Frost, A. J., Sana, H., Mahy, L., et al. 2024, Science, 384, 214 [NASA ADS] [CrossRef] [Google Scholar]
- Gaia Collaboration (Vallenari, A., et al.) 2023, A&A, 674, A1 [NASA ADS] [CrossRef] [EDP Sciences] [Google Scholar]
- Gies, D. R., Bagnuolo, J., William, G., Ferrara, E. C., et al. 1998, ApJ, 493, 440 [NASA ADS] [CrossRef] [Google Scholar]
- Golden-Marx, J. B., Oey, M. S., Lamb, J. B., Graus, A. S., & White, A. S. 2016, ApJ, 819, 55 [NASA ADS] [CrossRef] [Google Scholar]
- Götberg, Y., de Mink, S. E., Groh, J. H., et al. 2018, A&A, 615, A78 [NASA ADS] [CrossRef] [EDP Sciences] [Google Scholar]
- Graczyk, D., Pietrzyński, G., Thompson, I. B., et al. 2020, ApJ, 904, 13 [Google Scholar]
- Grebel, E. K., Richter, T., & de Boer, K. S. 1992, A&A, 254, L5 [NASA ADS] [Google Scholar]
- Grunhut, J. H., Wade, G. A., Neiner, C., et al. 2017, MNRAS, 465, 2432 [NASA ADS] [CrossRef] [Google Scholar]
- Haberl, F., & Sturm, R. 2016, A&A, 586, A81 [NASA ADS] [CrossRef] [EDP Sciences] [Google Scholar]
- Hastings, B., Wang, C., & Langer, N. 2020, A&A, 633, A165 [NASA ADS] [CrossRef] [EDP Sciences] [Google Scholar]
- Hastings, B., Langer, N., Wang, C., Schootemeijer, A., & Milone, A. P. 2021, A&A, 653, A144 [NASA ADS] [CrossRef] [EDP Sciences] [Google Scholar]
- Heber, U. 2009, ARA&A, 47, 211 [Google Scholar]
- Iqbal, S., & Keller, S. C. 2013, MNRAS, 435, 3103 [NASA ADS] [CrossRef] [Google Scholar]
- Irrgang, A., Przybilla, N., & Meynet, G. 2022, Nat. Astron., 6, 1414 [NASA ADS] [CrossRef] [Google Scholar]
- Izzard, R. G., & Jermyn, A. S. 2023, MNRAS, 521, 35 [NASA ADS] [CrossRef] [Google Scholar]
- Janssens, S., Shenar, T., Degenaar, N., et al. 2023, A&A, 677, L9 [NASA ADS] [CrossRef] [EDP Sciences] [Google Scholar]
- Keszthelyi, Z. 2023, Galaxies, 11, 40 [NASA ADS] [CrossRef] [Google Scholar]
- Kiminki, D. C., & Kobulnicky, H. A. 2012, ApJ, 751, 4 [NASA ADS] [CrossRef] [Google Scholar]
- Kippenhahn, R., & Weigert, A. 1967, ZAp, 65, 251 [Google Scholar]
- Klement, R., Schaefer, G. H., Gies, D. R., et al. 2022, ApJ, 926, 213 [NASA ADS] [CrossRef] [Google Scholar]
- Klement, R., Rivinius, T., Gies, D. R., et al. 2024, ApJ, 962, 70 [NASA ADS] [CrossRef] [Google Scholar]
- Kobulnicky, H. A., Kiminki, D. C., Lundquist, M. J., et al. 2014, ApJS, 213, 34 [Google Scholar]
- Koubský, P., Kotková, L., Votruba, V., Slechta, M., & Dvořáková, Š. 2012, A&A, 545, A121 [NASA ADS] [CrossRef] [EDP Sciences] [Google Scholar]
- Kříž, S., & Harmanec, P. 1975, Bull. Astron. Inst. Czech., 26, 65 [NASA ADS] [Google Scholar]
- Labadie-Bartz, J., Carciofi, A. C., Henrique de Amorim, T., et al. 2022, AJ, 163, 226 [NASA ADS] [CrossRef] [Google Scholar]
- Lamb, J. B., Oey, M. S., Segura-Cox, D. M., et al. 2016, ApJ, 817, 113 [NASA ADS] [CrossRef] [Google Scholar]
- Langer, N. 2012, ARA&A, 50, 107 [CrossRef] [Google Scholar]
- Langer, N., Schürmann, C., Stoll, K., et al. 2020, A&A, 638, A39 [NASA ADS] [CrossRef] [EDP Sciences] [Google Scholar]
- Mahy, L., Sana, H., Abdul-Masih, M., et al. 2020, A&A, 634, A118 [NASA ADS] [CrossRef] [EDP Sciences] [Google Scholar]
- Mahy, L., Lanthermann, C., Hutsemékers, D., et al. 2022, A&A, 657, A4 [NASA ADS] [CrossRef] [EDP Sciences] [Google Scholar]
- Maravelias, G., Zezas, A., Antoniou, V., & Hatzidimitriou, D. 2014, MNRAS, 438, 2005 [NASA ADS] [CrossRef] [Google Scholar]
- Marchant, P., & Bodensteiner, J. 2024, ARA&A, 62, 21 [NASA ADS] [CrossRef] [Google Scholar]
- McBride, V. A., González-Galán, A., Bird, A. J., et al. 2017, MNRAS, 467, 1526 [NASA ADS] [CrossRef] [Google Scholar]
- Milone, A. P., Marino, A. F., Di Criscienzo, M., et al. 2018, MNRAS, 477, 2640 [Google Scholar]
- Moe, M., & Di Stefano, R. 2017, ApJS, 230, 15 [Google Scholar]
- Nazé, Y., Ud-Doula, A., Spano, M., et al. 2010, A&A, 520, A59 [NASA ADS] [CrossRef] [EDP Sciences] [Google Scholar]
- Nazé, Y., Rauw, G., Czesla, S., Smith, M. A., & Robrade, J. 2022, MNRAS, 510, 2286 [CrossRef] [Google Scholar]
- Neiner, C., de Batz, B., Cochard, F., et al. 2011, AJ, 142, 149 [Google Scholar]
- Neuhäuser, R., Gießler, F., & Hambaryan, V. V. 2020, MNRAS, 498, 899 [CrossRef] [Google Scholar]
- Offner, S. S. R., Moe, M., Kratter, K. M., et al. 2023, in Astronomical Society of the Pacific Conference Series, 534, Protostars and Planets VII, eds. S. Inutsuka, Y. Aikawa, T. Muto, K. Tomida, & M. Tamura, 275 [Google Scholar]
- Packet, W. 1981, A&A, 102, 17 [NASA ADS] [Google Scholar]
- Paczyński, B. 1967, Acta Astron., 17, 355 [NASA ADS] [Google Scholar]
- Pasquini, L., Avila, G., Blecha, A., et al. 2002, The Messenger, 110, 1 [Google Scholar]
- Patrick, L. R., Lennon, D. J., Evans, C. J., et al. 2020, A&A, 635, A29 [NASA ADS] [CrossRef] [EDP Sciences] [Google Scholar]
- Patrick, L. R., Lennon, D. J., Najarro, F., et al. 2025, A&A, 698, A39 [NASA ADS] [CrossRef] [EDP Sciences] [Google Scholar]
- Pauli, D., Oskinova, L. M., Hamann, W. R., et al. 2022, A&A, 659, A9 [NASA ADS] [CrossRef] [EDP Sciences] [Google Scholar]
- Pawlak, M., Soszyński, I., Udalski, A., et al. 2016, Acta Astron., 66, 421 [Google Scholar]
- Phillips, G. D., Oey, M. S., Cuevas, M., Castro, N., & Kothari, R. 2024, ApJ, 966, 243 [Google Scholar]
- Podsiadlowski, P., Joss, P. C., & Hsu, J. J. L. 1992, ApJ, 391, 246 [Google Scholar]
- Pols, O. R., Cote, J., Waters, L. B. F. M., & Heise, J. 1991, A&A, 241, 419 [NASA ADS] [Google Scholar]
- Ramachandran, V., Klencki, J., Sander, A. A. C., et al. 2023, A&A, 674, L12 [NASA ADS] [CrossRef] [EDP Sciences] [Google Scholar]
- Ramachandran, V., Sander, A. A. C., Pauli, D., et al. 2024, A&A, 692, A90 [NASA ADS] [CrossRef] [EDP Sciences] [Google Scholar]
- Ramírez-Agudelo, O. H., Simón-Díaz, S., Sana, H., et al. 2013, A&A, 560, A29 [NASA ADS] [CrossRef] [EDP Sciences] [Google Scholar]
- Ramírez-Agudelo, O. H., Sana, H., de Mink, S. E., et al. 2015, A&A, 580, A92 [NASA ADS] [CrossRef] [EDP Sciences] [Google Scholar]
- Reig, P. 2011, Ap&SS, 332, 1 [Google Scholar]
- Renzo, M., & Götberg, Y. 2021, ApJ, 923, 277 [NASA ADS] [CrossRef] [Google Scholar]
- Rivinius, T., Carciofi, A. C., & Martayan, C. 2013, A&A Rev., 21, 69 [NASA ADS] [CrossRef] [Google Scholar]
- Rocha, K. A., Kalogera, V., Doctor, Z., et al. 2024, ApJ, 971, 133 [Google Scholar]
- Russell, S. C., & Dopita, M. A. 1990, ApJS, 74, 93 [NASA ADS] [CrossRef] [Google Scholar]
- Sabbi, E., Sirianni, M., Nota, A., et al. 2008, AJ, 135, 173 [NASA ADS] [CrossRef] [Google Scholar]
- Sana, H., James, G., & Gosset, E. 2011, MNRAS, 416, 817 [Google Scholar]
- Sana, H., de Mink, S. E., de Koter, A., et al. 2012, Science, 337, 444 [Google Scholar]
- Sana, H., de Koter, A., de Mink, S. E., et al. 2013, A&A, 550, A107 [NASA ADS] [CrossRef] [EDP Sciences] [Google Scholar]
- Sana, H., Le Bouquin, J. B., Lacour, S., et al. 2014, ApJS, 215, 15 [Google Scholar]
- Sana, H., Shenar, T., Bodensteiner, J., et al. 2025, Nat. Astron., submitted [Google Scholar]
- Saracino, S., Kamann, S., Guarcello, M. G., et al. 2022, MNRAS, 511, 2914 [NASA ADS] [CrossRef] [Google Scholar]
- Saracino, S., Shenar, T., Kamann, S., et al. 2023, MNRAS, 521, 3162 [NASA ADS] [CrossRef] [Google Scholar]
- Schneider, F. R. N., Ohlmann, S. T., Podsiadlowski, P., et al. 2019, Nature, 574, 211 [Google Scholar]
- Schootemeijer, A., Langer, N., Grin, N. J., & Wang, C. 2019, A&A, 625, A132 [NASA ADS] [CrossRef] [EDP Sciences] [Google Scholar]
- Schootemeijer, A., Langer, N., Lennon, D., et al. 2021, A&A, 646, A106 [NASA ADS] [CrossRef] [EDP Sciences] [Google Scholar]
- Schootemeijer, A., Lennon, D. J., Garcia, M., et al. 2022, A&A, 667, A100 [NASA ADS] [CrossRef] [EDP Sciences] [Google Scholar]
- Schürmann, C., Langer, N., Xu, X., & Wang, C. 2022, A&A, 667, A122 [NASA ADS] [CrossRef] [EDP Sciences] [Google Scholar]
- Sen, K., Langer, N., Marchant, P., et al. 2022, A&A, 659, A98 [NASA ADS] [CrossRef] [EDP Sciences] [Google Scholar]
- Sen, K., Langer, N., Pauli, D., et al. 2023, A&A, 672, A198 [NASA ADS] [CrossRef] [EDP Sciences] [Google Scholar]
- Shao, Y., & Li, X.-D. 2014, ApJ, 796, 37 [Google Scholar]
- Shao, Y., & Li, X.-D. 2021, ApJ, 908, 67 [NASA ADS] [CrossRef] [Google Scholar]
- Shenar, T., Bodensteiner, J., Abdul-Masih, M., et al. 2020, A&A, 639, L6 [EDP Sciences] [Google Scholar]
- Shenar, T., Wade, G. A., Marchant, P., et al. 2023, Science, 381, 761 [NASA ADS] [CrossRef] [Google Scholar]
- Shenar, T., Bodensteiner, J., Sana, H., et al. 2024, A&A, 690, A289 [NASA ADS] [CrossRef] [EDP Sciences] [Google Scholar]
- Smith, N. 2014, ARA&A, 52, 487 [NASA ADS] [CrossRef] [Google Scholar]
- Sturm, R., Haberl, F., Pietsch, W., et al. 2013, A&A, 558, A3 [NASA ADS] [CrossRef] [EDP Sciences] [Google Scholar]
- Townsend, R. H. D., Owocki, S. P., & Howarth, I. D. 2004, MNRAS, 350, 189 [Google Scholar]
- Vieira, K., García-Varela, A., Sabogal, B., Rímulo, L. R., & Hernández, J. 2021, MNRAS, 505, 5567 [CrossRef] [Google Scholar]
- Villaseñor, J. I., Taylor, W. D., Evans, C. J., et al. 2021, MNRAS, 507, 5348 [CrossRef] [Google Scholar]
- Villaseñor, J. I., Lennon, D. J., Picco, A., et al. 2023, MNRAS, 525, 5121 [CrossRef] [Google Scholar]
- Villaseñor, J. I., Sana, H., Mahy, L., et al. 2025, A&A, 698, A41 [NASA ADS] [CrossRef] [EDP Sciences] [Google Scholar]
- Vinciguerra, S., Neijssel, C. J., Vigna-Gómez, A., et al. 2020, MNRAS, 498, 4705 [NASA ADS] [CrossRef] [Google Scholar]
- Vink, J. S., de Koter, A., & Lamers, H. J. G. L. M. 2001, A&A, 369, 574 [NASA ADS] [CrossRef] [EDP Sciences] [Google Scholar]
- Waelkens, C. 1991, A&A, 244, 107 [NASA ADS] [Google Scholar]
- Walborn, N. R. 1972, AJ, 77, 312 [NASA ADS] [CrossRef] [Google Scholar]
- Wang, C., Langer, N., Schootemeijer, A., et al. 2020, ApJ, 888, L12 [NASA ADS] [CrossRef] [Google Scholar]
- Wang, L., Gies, D. R., Peters, G. J., et al. 2021, AJ, 161, 248 [Google Scholar]
- Wang, L., Gies, D. R., Peters, G. J., & Han, Z. 2023, AJ, 165, 203 [NASA ADS] [CrossRef] [Google Scholar]
- Wang, C., Bodensteiner, J., Xu, X.-T., et al. 2024, ApJ, 975, L20 [NASA ADS] [Google Scholar]
- Wellstein, S., Langer, N., & Braun, H. 2001, A&A, 369, 939 [NASA ADS] [CrossRef] [EDP Sciences] [Google Scholar]
- Zucker, S. 2003, MNRAS, 342, 1291 [NASA ADS] [CrossRef] [Google Scholar]
All Figures
|
Fig. 1 Distribution of spectral types in the OBe sample. The color indicates the assigned luminosity class of the stars (‘V’ and ‘IV’ in purple, ‘III’ in violet, ‘II’ in ocher, and stars without classification in gray). |
| In the text | |
|
Fig. 2 Spectra of four BLOeM emission-line stars, from top to bottom BLOem 2-104 (an Of?p stars with spectral type O5.5 f?pe), BLOeM 7-038 (with only weak emission infilling in the wings of the Balmer lines), BLOeM 4-002 (a B1.5: e star with broad absorption lines), and BLOeM 7-082 (a B2 e+ star with narrow absorption lines and strong double-peaked Balmer emission). |
| In the text | |
|
Fig. 3 Maximum RV amplitude for all sample stars, with a zoom-in around lower RVs. Apparently single stars are shown in blue, binary candidates in green and binaries in yellow. Also indicated are the two Of?p stars (dark blue) and the two interacting binaries (orange). Both components of the SB2 BLOeM 6-034 are included. Our RV threshold RVcrit = 20 km s−1 is given by red dotted lines. |
| In the text | |
|
Fig. 4 Location of detected binaries (yellow stars), binary candidates (green diamonds), and apparently single stars (blue circles) across the eight fields (dotted orange circles). Also indicated are the two Of?p stars (dark blue circles) and the two interacting binaries (orange stars). The background is a false-color (Y-J-KS) image from VISTA (ESO/VISTA VMC, Cioni et al. 2011). |
| In the text | |
|
Fig. 5 Binary statistics as a function of spectral type (see also Fig. 1). The color coding is the same as in Fig. 4. |
| In the text | |
|
Fig. 6 Binary statistics in the Gaia CMD (same color coding as Fig. 4). Over-plotted is the BLOeM sample (blue dots, Paper I), all Gaia sources from which the sample was selected (gray dots), and evolutionary tracks from the extension of the grid of Schootemeijer et al. (2019) with initial masses as indicated. |
| In the text | |
|
Fig. 7 Binary detection probability pdetect as a function of period and mass ratio for a 10 M⊙ Be star. Overplotted are OBe binaries with known periods and mass ratios from Klement et al. (2024) and Wang et al. (2023, Be+sdOBs in orange and Be binaries with companions of uncertain or debated nature in yellow), and recently stripped stars from Shenar et al. (2020), Bodensteiner et al. (2020b), Pauli et al. (2022) and Ramachandran et al. (2024). Overplotted are also lines for potential Be+NS binaries (assuming NS masses between 1.4 and 3 M⊙), and a Be binary with an 8 M⊙BH companion. |
| In the text | |
|
Fig. A.1 Observed binary fraction as a function of critical RV threshold value RVcrit. The adopted value of 20 km s−1 is indicated by the blue vertical line. |
| In the text | |
|
Fig. B.1 RV curve of BLOeM 3-031 (filled red dots) with the photometric orbit overplotted (gray), as a function of time (upper panel) and orbital phase (lower panel). In the phase-folded curve we also include the assuming T0 = T0−0.4 days, which provide a much better fit to the data. |
| In the text | |
|
Fig. B.2 RV curves of BLOeM 6-034 (red and blue dots, for the two components visible in the spectra) with the photometric orbits overplotted (in matching colors), as a function of time (upper panel) and orbital phase (lower panel). |
| In the text | |
|
Fig. C.1 Same as Fig. 4, with the HHMXBs of Antoniou et al. (2019) and the BeXRBs of Coe & Kirk (2015) indicated in purple and pink, respectively. |
| In the text | |
|
Fig. C.2 Same as Fig. 6, but with the HMXBs of Antoniou et al. (2019) and the BeXRBs of Coe & Kirk (2015) overlain in purple and pink, respectively. Note the adopted magnitude cut extending to fainter objects here to show the faintness of the HMXBs in particular in the Antoniou et al. (2019) catalog. |
| In the text | |
Current usage metrics show cumulative count of Article Views (full-text article views including HTML views, PDF and ePub downloads, according to the available data) and Abstracts Views on Vision4Press platform.
Data correspond to usage on the plateform after 2015. The current usage metrics is available 48-96 hours after online publication and is updated daily on week days.
Initial download of the metrics may take a while.