Open Access
Fig. 6
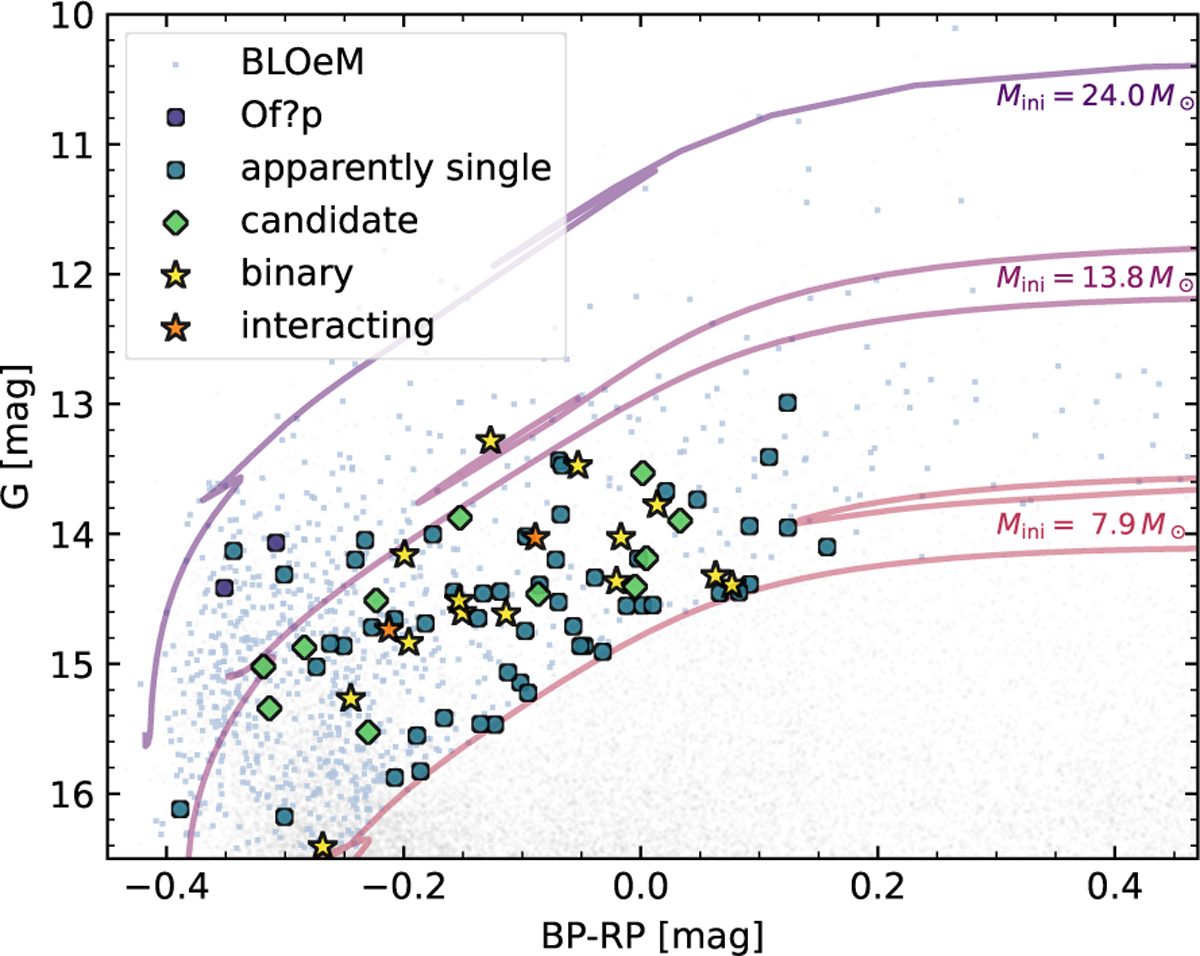
Download original image
Binary statistics in the Gaia CMD (same color coding as Fig. 4). Over-plotted is the BLOeM sample (blue dots, Paper I), all Gaia sources from which the sample was selected (gray dots), and evolutionary tracks from the extension of the grid of Schootemeijer et al. (2019) with initial masses as indicated.
Current usage metrics show cumulative count of Article Views (full-text article views including HTML views, PDF and ePub downloads, according to the available data) and Abstracts Views on Vision4Press platform.
Data correspond to usage on the plateform after 2015. The current usage metrics is available 48-96 hours after online publication and is updated daily on week days.
Initial download of the metrics may take a while.