| Issue |
A&A
Volume 629, September 2019
|
|
|---|---|---|
| Article Number | A101 | |
| Number of page(s) | 10 | |
| Section | Stellar structure and evolution | |
| DOI | https://doi.org/10.1051/0004-6361/201936045 | |
| Published online | 11 September 2019 | |
NuSTAR observations of wind-fed X-ray pulsar GX 301–2 during unusual spin-up event
1
Department of Physics and Astronomy, University of Turku, Turku 20014, Finland
e-mail: This email address is being protected from spambots. You need JavaScript enabled to view it.
2
Space Research Institute of the Russian Academy of Sciences, Profsoyuznaya Str. 84/32, Moscow 117997, Russia
3
Institut für Astronomie und Astrophysik, Universität Tübingen, Sand 1, 72076 Tübingen, Germany
4
Nordita, KTH Royal Institute of Technology and Stockholm University, Roslagstullsbacken 23, 10691 Stockholm, Sweden
Received:
7
June
2019
Accepted:
29
July
2019
Abstract
We report on NuSTAR observations of the well-known wind-accreting X-ray pulsar GX 301–2 during a strong spin-up episode that took place in January–March 2019. A measurement of high luminosity of the source in the most recent observation allowed us to detect a positive correlation of the cyclotron line energy with luminosity. Beyond that, only minor differences in spectral and temporal properties of the source during the spin-up, presumably associated with the formation of a transient accretion disk, and the normal wind-fed state could be detected. Finally, we discuss conditions for the formation of the disk and possible reasons for lack of any appreciable variations in most of the observed source properties induced by the change of the accretion mechanism, and conclude that the bulk of the observed X-ray emission is still likely powered by direct accretion from the wind.
Key words: accretion / accretion disks / magnetic fields / pulsars: individual: GX 301–2 / stars: neutron / X-rays: binaries
© ESO 2019
1. Introduction
X-ray pulsars (XRPs) are binary systems in which a neutron star (NS) with strong magnetic field accretes matter from its companion star. Accretion flow is funneled by the magnetic field to the surface of spinning NS where pulsed X-ray emission is produced. Based on the dominant mass-transfer mechanism, two classes of XRPs are usually defined: wind-fed and disk-fed XRPs. The wind-accreting XRPs are fed directly by accretion of dense wind from their giant companions, whereas the disk-accreting systems transfer mass onto a NS through the Roche-lobe overflow or periodically from decretion disks of Be donors. Under certain conditions, a transient accretion disk can also be formed in wind-fed systems, for example as recently discussed by Karino et al. (2019). The accretion mechanism defines the material torques affecting the NS, and the total torque either decelerating or accelerating the NS rotation. Given that accretion disks can only form when the accretion flow carries substantial angular momentum, disk accretion implies stronger accelerating torque, and so the appearance of an accretion disk can be manifested as a spin-up event (see, e.g., Soker 2004).
GX 301–2 (also known as 4U 1223−62) is a high mass X-ray binary system (HMXB) containing an XRP with a period of ∼680 s, one of the longest observed (White et al. 1976). In this system, accretion is normally fed by the wind from the hypergiant donor star, Wray 977. Spectral classification of the donor was used by Parkes et al. (1980) to measure the distance to the system of 1.8 kpc, however, Kaper et al. (1995) later obtained 5.3 kpc. On the other hand, the Gaia parallax measurement implies  kpc (Treuz et al. 2018; Bailer-Jones et al. 2018). This discrepancy might affect some of the derived properties of the companion, which is however a massive early B-type star with a mass of 39–53 M⊙ and a radius of ∼62 R⊙ (Kaper et al. 2006). The donor also exhibits extremely high mass-loss rate Ṁ ∼ 10−5 M⊙ yr−1, one of the highest rates known in the galaxy. The wind is slow (∼300–400 km s−1; Kaper et al. 2006), which allows the pulsar to capture it, effectively reaching the X-ray luminosity of up to 1037 erg s−1. The orbital period of the system is ∼41.482 ± 0.001 d (Doroshenko et al. 2010) with the orbit characterized by a high eccentricity of e ∼ 0.46 (Koh et al. 1997).
GX 301–2 exhibits regular periodic X-ray outbursts associated with orbital motion, ∼1.4 d before the periastron passage where the accretion rate is highest (Pravdo & Ghosh 2001). A second peak in the orbital light curve occurs, however, near the apastron passage at the orbital phase ∼0.5 (Pravdo et al. 1995; Koh et al. 1997), which is harder to explain. So far, several models have been proposed to interpret the observed orbital light curve of the source. An inclined circumstellar disk feeding the accretion around the periastron and apastron of Wray 977 was suggested (Pravdo et al. 1995; Koh et al. 1997; Pravdo & Ghosh 2001). However, optical observations did not confirm presence of such a disk (Kaper et al. 2006). Another possibility was proposed by Leahy (2002) and Leahy & Kostka (2008), who argued that in addition to homogeneous stellar wind, a high-density accretion stream trailing the NS along the orbit is present in the system. The stream origin is associated with tidal interactions, and the observed peaks in the orbital light curve are attributed to crossings of the stream by the pulsar near the periastron and apastron. Spectral analysis of the optical companion found the evidence for such a spiral-type stream in this system (Kaper et al. 2006), moreover, later mid-infrared interferometry confirmed the presence of the stream in the system (Waisberg et al. 2017).
The X-ray spectrum of GX 301–2 has been reported to exhibit two absorption features at 34 and 51 keV (Fürst et al. 2018) interpreted as Cyclotron Resonant Scattering Features (CRSFs), although earlier investigations found a single pulse-phase-dependent feature around 30–50 keV (Kreykenbohm et al. 2004; La Barbera et al. 2005), confirming some ambiguity in interpretation of the spectrum. The variation of the CRSF energy with pulse and orbital phase has been a topic of several investigations (Kreykenbohm et al. 2004; La Barbera et al. 2005; Doroshenko et al. 2010). The reason is that in several XRPs, the centroid energy of the CRSF has been reported to change with luminosity (see e.g., Mihara et al. 1998; Staubert et al. 2019). In particular, in low luminosity XRPs, the energy of the line seems to be correlated with flux (Staubert et al. 2007; Klochkov et al. 2012), whereas at higher accretion rates the correlation tends to be negative (Tsygankov et al. 2006, 2010; Nakajima et al. 2006). The change in luminosity-dependency has been connected to the source exceeding the critical luminosity when the accretion column starts to rise (Basko & Sunyaev 1976; Becker et al. 2012; Mushtukov et al. 2015). Recently this scenario was confirmed observationally when both types of behavior with the transition at expected luminosity were observed in V 0332+53 (Doroshenko et al. 2016).
La Barbera et al. (2005) studied the X-ray spectrum of GX 301–2 over an orbital cycle of the binary and found no evidence of variations of the CRSF with luminosity, pointing to sub-critical accretion. Later, Suchy et al. (2012) reported a hint of anti-correlation, although in this case as well, a definite conclusion on the accretion regime could not be made. Here we report on recent NuSTAR observations of the source during a rapid spin-up episode when luminosity of the source was higher than usual (see Fig. 1). Several rapid spin-up episodes associated with the formation of a transient accretion disk have been reported for GX 301–2 (Koh et al. 1997; Bildsten et al. 1997), however, until now, no dedicated broadband observations have been carried out in this state. Using the archival NuSTAR observations of the source in normal state as a baseline, we investigated how the presence of an accretion disk affects the temporal and spectral properties of the source. We revisit the issue of luminosity dependence of the CRSF and discuss how these irregular spin-up events can be related to the apastron passages.
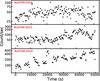 |
Fig. 1. X-ray light curves of GX 301–2 extracted from three NuSTAR observations in energy range 3–79 keV. |
2. Observations and data reduction
The NuSTAR observatory consists of two co-aligned grazing incidence X-ray telescope systems, Focal Plane Module A and B (FPMA and FPMB), with independent CdZnTe detector units operating in a wide energy range of 3–79 keV (Harrison et al. 2013). It provides X-ray imaging resolution of 18″ full width at half-maximum (FWHM) and spectral resolution of 400 eV (FWHM) at 10 keV. GX 301–2 was observed by NuSTAR three times on October 2014, October 2015, and March 2019 (see Table 1 for more details). The first observation (ObsID 30001041002) was performed soon after the apastron passage, while the second one (ObsID 30001042002) was scheduled at an intermediate phase between apastron and periastron. The most recent ToO observation is the main topic of current investigation (ObsID 90501306002; PI Mönkkönen), and was performed on 3 March 2019 with an exposure time of 36.1 ks. This observation specifically targeted the rare rapid spin-up episode (MJD 58475–58550), and is the first dedicated observation of GX 301–2 in such a state. The exact orbital phases corresponding to NuSTAR observations are listed in Table 1 and indicated in Fig. 8. Using the standard data reduction procedure explained in the NuSTAR user guide1, we reduced the data and extracted the source spectra and the light curves using the NuSTAR Data Analysis Software NUSTARDAS v1.8.0 with a CALDB version 20180419. To extract the data products we used a source-centered circular region with radius of 120″ for both FMPA and FMPB. The background was extracted similarly from a source-free circular region of the same radius in the corner of the field of view. We then applied the barycentric correction to all the resulting light curves using the standard BARYCORR task. In order to increase the signal-to-noise ratio and ensure reliable statistics in the spectral bins, the spectra were grouped to have at least 70 counts in each energy bin. The spectra of the source measured by the two NuSTAR units were fitted independently as recommended in instrument documentation.
NuSTAR observations of GX 301–2.
3. Analysis and results
3.1. NuSTAR observation of the spin-up episode.
In March 2019, the Fermi Gamma-ray Burst Monitor detectors (GBM Pulsar Project2) detected a rapid spin-up episode for GX 301–2, which is the fourth such episode in the history of observations of the source, and the most powerful in recent years. The change of the pulse frequency as observed by Fermi/GBM (Meegan et al. 2009) and the simultaneous count rates obtained by Swift/BAT (Krimm et al. 2013) in the energy range 15–50 keV3 are shown in Fig. 2.
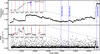 |
Fig. 2. Upper panel: pulse frequency of GX 301–2 observed with GBM Pulsar Project. Lower panel: X-ray count rate seen by Swift/BAT in energy range 15–50 keV. Dashed blue lines show the dates when the NuSTAR observations were performed. In each panel the recent spin-up episode is zoomed-in, with the periastron passages marked with the dashed red lines and the apastron passages shown with the dotted blue lines. |
Prior to the spin-up episode the source exhibited an initial pre-periastron flare on MJD 58465, followed by an approximately ten-day flux decay. On MJD 58475, the flux started to rise again at phase ∼0.25 marking the start of the spin-up episode. This secondary flare peaked at phase ∼0.5 on MJD 58484, the first day of 2019, when the pulsed flux also rose suddenly. The flux remained elevated until a multipeaked pre-periastron flare took place from MJD 58503 to 58510 (around the expected flare on MJD 58507). The average spin-frequency derivative during the strong spin-up was 0.2 mHz yr−1. The flux dropped after the periastron passage, which affected the spin frequency evolution. In a period from MJD 58527 to 58548 between apastron and periastron passages, the flux was slightly above average, and the source exhibited spin-up with a lower average derivative of 0.07 mHz yr−1. Our NuSTAR observation took place during this period on MJD 58545, right before the source reached the pre-periastron flare around MJD 58548, meaning close to the end of the most recent spin-up episode and lasting ∼70 d with pulse period decreasing in total from 684 s to 672 s.
As seen in Fig. 1, the object was significantly brighter and varied on a larger scale during the latest NuSTAR observation compared to the previous two observations with the same instrument. In particular, the mean count rate increased by ∼200 cnt s−1, and a strong flare/outburst of ∼20 ks after the beginning of observation lasting for a couple pulse periods was observed. Given that the three NuSTAR observations took place at different orbital phases, and leaving aside the fact that the source is more variable near the periastron, the higher flux level is probably not directly related to the spin-up episode.
3.2. Pulse profile and pulsed fraction
For timing analysis we corrected light curves for the binary motion using the orbital parameters reported by Koh et al. (1997) and Doroshenko et al. (2010) as Porb = 41.472 d, ax sin i = 368.3 lt s,  , Tperiastron = MJD 53531.65, and e = 0.462. To estimate the pulse period for each observation, we used the standard epoch folding technique (Leahy et al. 1983) using the EFSEARCH procedure from the FTOOLS package, which yielded the spin periods as P2014 = 686.47(3) s, P2015 = 685.94(1) s, and P2019 = 672.51(5) s. Uncertainties were determined from simulations of a large number of light curves using count rates and corresponding error bars from the original data (for details, see Filippova et al. 2004, and references therein).
The wide energy coverage of NuSTAR allows the study of energy dependence of pulse profiles. Considering the available counting statistics, we extracted the light curves in five different energy ranges 3–7, 7–18, 18–30, 30–50, and 50–79 keV from all three observations. We verified that light curves extracted from two modules are consistent with each other, and therefore, co-added the data from both detectors to improve counting statistics. Using the task EFOLD from XRONOS package, we folded the energy-dependent light curves of each observation with the corresponding pulse period.
First, we compare the pulse profiles during the wind-fed accretion states in Fig. 3. The zero phases are chosen to maximize the cross-correlation function (CCF). Then in Fig. 4, we compare the pulse profiles obtained in 2019 during the disk-fed state to those obtained in 2014 in the wind-fed state. The five top panels in these two figures show the evolution of the pulse profiles with energy increasing from top to bottom. In all three observations the pulse profiles are double-peaked with complex substructures present in lower energy bands and with a tendency for the shape simplification at higher energies. In particular, the broad main peak in 3–7 keV is getting narrower at higher energies. In order to better emphasize the difference between the pulse profiles observed in wind-fed and disk-fed states, we show their ratios for 2014 and 2015 observations (wind-wind) and for 2014 and 2019 observations (wind-disk) in three energy bands 3–7, 18–30, and 30–50 keV in the three bottom panels of Figs. 3 and 4. The low amplitude variations of the ratio in wind-wind scenario confirms that GX 301–2 has a similar geometrical configuration when accreting from the wind. Although stronger phase dependence of the wind-disk ratio is apparent from the bottom panels of Fig. 4, the overall structure and energy dependence of the pulse profiles in different accretion regimes suggest generally similar structures of the emission region in both cases.
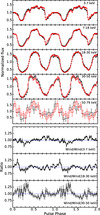 |
Fig. 3. Top panels: pulse profiles of GX 301–2 in five different energy bands 3–7, 7–18, 18–30, 30–50, and 50–79 keV (from top to bottom) obtained by NuSTAR observations in 2014 (red) and 2015 (black) during the wind accretion phases. The fluxes are normalized by the mean flux in each energy band. The zero phase was chosen to maximize the CCF. Bottom panels: ratio of the GX 301–2 pulse profiles during the wind-fed states (wind/wind) obtained using 2014 and 2015 observations in the energy bands 3–7, 18–30, and 30–50 keV. The ratio of unity is shown by the horizontal blue line. |
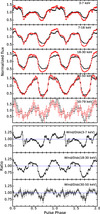 |
Fig. 4. Same as Fig. 3, but for observations in 2014 (red) and 2019 (black) in which NS was accreting from wind and disk, respectively. |
This difference is also captured by energy dependence of the pulsed fraction defined as PF = (Fmax − Fmin)/(Fmax + Fmin) as illustrated in Fig. 5. Here Fmin and Fmax are the minimum and maximum fluxes of the pulse profile. While in all three observations the pulsed fraction generally increases with energy as observed for the majority of XRPs (Lutovinov & Tsygankov 2009), the pulsed fraction in the hard band (8–20 keV) appears to be significantly lower during the spin-up phase. In addition, we observe a sharp decrease of the pulsed fraction associated with the iron Kα emission line in the 6–7 keV range.
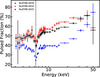 |
Fig. 5. Energy dependence of pulsed fraction of GX 301–2 obtained from NuSTAR observations in 2014 (red crosses), 2015 (black crosses), and 2019 (blue crosses). The vertical dashed line indicates the centroid of the iron Kα emission line. |
4. Spectral analysis
The spectrum of GX 301–2, as typical for other accreting XRPs, is believed to be due to a Comptonization process in the vicinity of a NS. Such a continuum has a power-law shape with a cut-off at the energy related to the temperature of the Comptonizing region. Therefore, in the early studies of the source, a modified high-energy cut-off (La Barbera et al. 2005) and Fermi-Dirac cut-off (Kreykenbohm et al. 2004) were used. Regardless the assumed intrinsic spectrum, inclusion of a partial-covering absorber was found to be required to account for both interstellar absorption and absorption within the binary system (Kreykenbohm et al. 2004; La Barbera et al. 2005).
Using the RXTE data, Kreykenbohm et al. (2004) confirmed that there is a broad CRSF at 35 keV, which was first detected by Mihara et al. (1995). The authors found that the energy of the line is strongly variable with pulse phase changing between 30 and 40 keV. Later, Suchy et al. (2012) associated the observed sinusoidal variations of the line energy with the pulse phase with the change of the angle between the line of sight and the magnetic field of the NS. La Barbera et al. (2005) studied BeppoSAX observations and detected a CRSF at two different energies, which changed with orbital phase 45 and 53 keV for periastron and pre-periastron, respectively. Later, using the Comptonization model COMPST by Sunyaev & Titarchuk (1980) to describe the continuum, Doroshenko et al. (2010) detected a CRSF at ∼46 keV in the INTEGRAL data, confirming the values reported by La Barbera et al. (2005).
In 2018, Fürst et al. (2018) published a detailed spectral analysis of GX 301–2 using the two NuSTAR observations from 2014 to 2015 when the source was accreting from the wind (the same observations we used here). They applied several phenomenological models such as NPEX (Mihara et al. 1998), FDCUT (Tanaka 1986), and HIGHECUT together with a partial covering absorber model to fit the spectra. Two Gaussian absorption features associated with the CRSF were also required to model the spectrum. The energies of the two features at ∼35 and ∼50 keV do not appear to be harmonically related because no features around 17 keV were found. Fürst et al. (2018) suggested that both features are likely associated with the fundamental cyclotron line, but originate at two different altitudes, for example at the NS surface and 1–1.4 km above the surface in the accretion column. Here we use a similar approach in order to facilitate the comparison between the disk and the wind-fed states.
4.1. Phase-averaged spectroscopy
We used all three NuSTAR data sets to investigate the evolution of the spectrum using XSPEC version 12.9.1p (Arnaud 1996). In order to perform the phase-averaged spectral analysis, the spectra were extracted using the procedure described in Sect. 2. Following Fürst et al. (2018), to describe the spectral shape we considered a power-law model with a Fermi-Dirac cutoff (FDCUT; Tanaka 1986):
 (1)
(1)
where APL and Γ are the power-law normalization constant and the photon index, and Ecut and Efold are the cutoff and the folding energies of the Fermi-Dirac cutoff. Similarly to earlier reports we found also that a two-component absorption model was required to describe the spectrum with two column densities NH, 1 (which is responsible for interstellar absorption) and NH,2 (which is responsible for the local absorption). In practice, we modeled the absorption using TBABS, the Tuebingen-Boulder interstellar medium absorption model (Wilms et al. 2000) together with a partial covering absorption (TBPCF) to determine the corresponding values of NH, 1 and NH,2. Interstellar absorption can be estimated based on radio data using the online tool NHTOT4 (Willingale et al. 2013), where the mean value of the hydrogen column density in the direction of GX 301–2 is reported as 1.4 × 1022 cm−2. We fixed NH, 1 at this value and let NH,2 vary.
Similarly to Fürst et al. (2018), we also found residuals in the soft band which we accounted for by inclusion of a blackbody component (BBODYRAD in XSPEC) with the temperature of ∼1.4 keV, which significantly improved the fit. On the other hand, Fürst et al. (2018) associated the soft-band residuals with slight miscalibration of NuSTAR gain, and added a gain shift to the FMPA spectrum finding a discrepancy of ∼20 eV in gain between the NuSTAR instruments. In any case, either approach does not affect the spectra in the hard band, which are of interest here.
We added two Gaussian absorption line models (GABS in XSPEC) to account for the CRSF lines previously detected for the source. As expected the residuals were significantly improved. We also used a GAUSSIAN component to account for the iron fluorescent emission line; it has a peak at 6.32 keV and normalization AFe = 5.6 × 10⁻³ ph s−1 cm−2. The width was kept frozen at 0.001 keV. These line parameters are consistent with other X-ray analyses of GX 301–2 (Kreykenbohm et al. 2004; La Barbera et al. 2005; Suchy et al. 2012; Doroshenko et al. 2010; Fürst et al. 2018). Finally, to take into account the uncertainty in the absolute flux calibration between NuSTAR instruments, FPMA and FPMB, a multiplicative constant was added to the model, which gives a normalization factor of 1.017. Consequently, the best-fit was obtained by a complex model constructed as constant × tbabs × tbpcf × gabs × gabs × (bbodyrad + fdcut + gaussian), yielding  for 1808 degrees of freedom using the 2019 NuSTAR observation. The broadband phase-averaged spectra of GX 301–2 obtained by NuSTAR in 2019 and the corresponding residuals from the best-fit model are shown in Fig. 6. The best-fit parameters and the corresponding uncertainties are also summarized in Table 2.
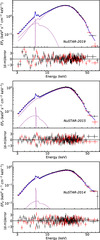 |
Fig. 6. Upper panels: broadband spectrum of GX 301–2 obtained by FPMA and FPMB/NuSTAR (red and black crosses) in 2019, 2015, and 2014 together with best-fit model constant × tbabs × tbpcf × gabs × gabs × (bbodyrad + fdcut + gaussian) (solid line). Different continuum components and the iron line are shown with dashed lines. Bottom panels: residuals from best-fit model in units of standard deviations. |
Best-fit model parameters for NuSTAR averaged spectra of 2019, 2015, and 2014.
There is no agreement on the value of the cutoff energy for GX 301–2 as different models used to fit the spectra of the source yielded different values. Our best-fit model gives  keV, which is consistent with the value ∼29 keV reported by Suchy et al. (2012), who used the Suzaku observation. Kreykenbohm et al. (2004) obtained Ecut = 10–15 keV by using the Fermi-Dirac cutoff to fit the RXTE data taken at the periastron passage. Other studies also reported the cutoff energy as ∼20 keV (RXTE; Mukherjee & Paul 2004), ∼20 keV (BeppoSAX; La Barbera et al. 2005), and ∼45 keV (NuSTAR; Fürst et al. 2018). The folding energy
  keV is also consistent with the results obtained by Kreykenbohm et al. (2004) and Fürst et al. (2018).
For the value for the local absorption we obtained NH,2 = 5.1 × 1023 cm−2. It shows how deeply the NS is engulfed by the companions wind. Our best-fit NH,2 value is higher than the one reported by La Barbera et al. (2005) who used two WABS models (Morrison & McCammon 1983) to account for the photoelectric absorption. This inconsistency can be due to the different cross-section and continuum models used for fitting the spectra. We also confirm the presence of the two absorption features
reported in previous studies. We find that the first line (CRSF1; following definition from Fürst et al. 2018) is centered at 55.1 keV with a width of σCRSF1 = 4.2 keV and a line depth of DCRSF1 = 8.5. The second line (CRSF2) is detected at 36.7 keV with σCRSF2 and DCRSF2 of 11.8 keV and 42.1, respectively. The results are slightly different compared to previous studies (Kreykenbohm et al. 2004; Fürst et al. 2018) where
the lines were reported at similar energies. We note, however, that findings reported in the literature are also controversial, for example a single feature at ∼46 keV was reported by La Barbera et al. (2005) and Doroshenko et al. (2010). We find that NuSTAR data are better described by a former model, and do not find any evidence for a ∼46 keV feature.
We also applied our best-fit model to the two archival NuSTAR observations taken in 2014 and 2015 in order to see the differences between the wind-fed and disk-fed states. The best-fit parameters for these two observations are listed in Table 2 and the corresponding phase-averaged spectra are shown in Fig. 6. The parameters for these two observations are broadly consistent with previous studies of the source. For the 2015 spectrum the fit detected the CRSF1 at 50.1 keV and CRSF2 at 35.8 keV; both values are consistent with the results reported by Fürst et al. (2018) who also used the Fermi-Dirac cutoff (FDCUT) model. However, both are smaller than the values we reported for the disk-fed state spectra (from NuSTAR 2019). Similarly, for the 2014 spectrum, the fit yielded the CRSF lines at 49.6 and 34.6 keV and the cutoff energy at 44.5 keV, which is consistent with the values reported by Fürst et al. (2018). However, our cutoff energy for the 2015 observation is 31.0 keV, which is smaller that what Fürst et al. (2018) obtained for this observation. The NH,2 for 2015 and 2014 are ∼3.2 × 10²³ and ∼4 × 1023 cm−2, respectively, which is consistent with the results presented by Fürst et al. (2018), though both are smaller than the column density obtained for the 2019 spectra. The other parameters are more or less consistent with the values from the 2019 observation.
4.2. Phase-resolved spectroscopy
Variations of the spectral parameters with pulse phase can provide useful insights about the physical conditions in the emission region. Therefore, we performed phase-resolved spectroscopy for GX 301–2 to study the evolution of the spectral parameters as a function of pulse phase. We split the spin period into nine phase bins as indicated in Fig. 7. The width of the bins was chosen at Δϕ = 0.1, except the ninth one, which was chosen to be Δϕ = 0.2 to ensure comparable counting statistics in all the bins. After extracting the spectra for each phase bin, we grouped them to have at least one count in each energy bin. We then fitted each spectrum with the same model we used to describe the averaged spectra and used the W-statistics (Wachter et al. 1979) to describe the quality of the fit. Due to the limited statistics, we fixed the width of CRSF1 σCRSF1 to the phase-averaged value as it was poorly constrained.
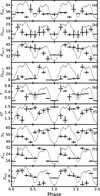 |
Fig. 7. Spectral model parameter variations as function of pulse phase. The crosses from the uppermost to the lowest panel show: (a) first cyclotron line energy (CRSF1), (b) first cyclotron line depth, (c) second cyclotron line energy (CRSF2), (d) second cyclotron line depth, (e) photon index, (f) blackbody temperature, (g) partial covering column density NH,2, (h) cutoff energy, and (i) folding energy. The gray line in each panel indicates the averaged pulse profile in the energy range 3–79 keV. |
It is interesting to note that phase dependence of energies of the two absorption features are quite different. The position of the first CRSF remains almost constant at around 55 keV except for the main maximum of the pulse where it drops to ∼50 keV, meaning it lies in the range 44–55 keV reported by Fürst et al. (2018) for the 2015 NuSTAR observations. The depth of the line, DCRSF1, varies from 5 to 16 and the minimum is achieved in the fall of the main peak between the pulses. Energy of the second CRSF changes between 30 keV in the fall of the second pulse to the 40 keV in the middle of the main pulse. Similar behavior for the low-energy CRSF was also reported by Kreykenbohm et al. (2004) and Suchy et al. (2012). However, the trend is not consistent with Fürst et al. (2018) where the CRSF is reported to be maximal at the rising part of the second pulse and minimal at the falling part of the same pulse. The line depth DCRSF2 varies mostly in the range of 0.5–12 except for the rising phase of the second pulse where it reaches 44.
The photon index Γ changes slightly from −0.18 in the main minimum to 0.62 near the main maximum. It decreases in the falling part of the main pulse, remains almost constant during the second pulse, and again decreases in the fall of the second pulse. These values roughly match the results by Kreykenbohm et al. (2004) (Γ between −0.2 and 1.0) but contrast with the results of Suchy et al. (2012), where Γ varies in the range 0.5–1.3. The NuSTAR 2014 and 2015 data also showed photon index variations between 0.5–1.2 throughout the pulse (Fürst et al. 2018). The cutoff energy is more variable, varying from ∼15 keV in the main minimum to ∼31 keV in the second pulse. The folding energy Efold is slightly correlated with the pulse amplitude and shows a minimum of ∼4 keV in the rising part of the second peak and a maximum of 7 keV in the middle of the main peak. The temperature of the soft component is quite stable over the pulse with very small variations between 1.27 and 1.51 keV. The absorbing component NH,2 (from the clumped wind) varies in the range 4−6 × 1023 cm−2. The covering fraction as expected is quite consistent with the phase-averaged value and has very small variations around 0.84.
5. Discussion
5.1. Spectral features
Our best-fit model for the latest NuSTAR observation during the 2019 spin-up episode implies that the overall spectral shape is similar to what was previously reported in the literature for the wind-fed state. The detected CRSFs’ energies of ∼55 and ∼37 keV are, however, slightly higher than the values obtained with the same model for observations outside of the spin-up episode (∼50 and ∼36 keV, respectively). In the energy range 3–79 keV, the absorbed X-ray fluxes for the three observations of the source in 2019, 2015, and 2014 are significantly different at 8.3 × 10⁻⁹, 2.5 × 10⁻⁹, and 1.6 × 10⁻⁹ erg s−1 cm−2, respectively, so this difference in spectral shape might be simply associated with the source luminosity rather than the accretion state. That is, a higher CRSF energy corresponds to the higher flux, which might indicate a positive correlation between the luminosity and the CRSF energy. We note that La Barbera et al. (2005) also found evidence for a positive CRSF energy–luminosity correlation for the source, which would imply a sub-critical regime of accretion in this source. Kreykenbohm et al. (2004) also suggested that accretion might be sub-critical, associating the observed dependence of the CRSF energy on pulse phase with rotation of the NS.
On the other hand, Fürst et al. (2018) note that a positive luminosity-correlation of the CRSF can be explained if the deceleration happens in two stages, first in the radiation-dominated shock and second closer to the NS surface by Coulomb collisions. This, according to Becker et al. (2012), would require a NS mass in excess of 1.8 M⊙. The deviation in the ratio of energies of the two absorption features have thus been attributed to a difference in altitude of 1.4 km of the two emission regions, with the high-energy CRSF originating from the NS surface and the low-energy one from the accretion shock. In the 2019 observation likewise, the ratio of the energies of the two features does not appear to be harmonic, so the issue persists. Doroshenko et al. (2010) also invoked a tall accretion column to reconcile the high magnetic field of the source deduced from the observed spin-evolution with the observed line energy, which would be in odds with the sub-critical accretion. The presence of two non-harmonically related lines may be explained by the off-set magnetic dipole (Iyer et al. 2015), which would naturally produce two poles of different magnetic field strengths.
5.2. Disk or wind accretion?
Mass transfer in the system has been suggested to occur both through homogeneous wind and a focused gas stream, which hits the NS close to the periastron and apastron, and shapes the observed orbital light curve (Leahy 1991). Leahy & Kostka (2008) fitted the orbital light curve and found that the mass-loss rate in the stream is a factor of two higher than in the companion wind, making the stream an important component. Their model required wind velocities from 400 to 600 km s−1, which are in agreement with spectral observations of Kaper et al. (2006). Understanding how the mass transfer happens is important for determining the material torques experienced by the NS.
The newly observed strong spin-up episode of GX 301–2 is difficult to explain with direct wind accretion. Earlier, Koh et al. (1997) reported two strong spin-up events that took place in 1991 and 1993 and suggested that these were the result of a transient accretion disk forming around the NS and providing a steady acceleration torque. The spin-up episodes began shortly after the periastron passage and lasted from 10 to 30 days, which corresponds to a viscous timescale of the disk (Koh et al. 1997). The infrequent spin-up events cannot be primarily due to a tidal outflow at the periastron passage, but more likely related to episodes of enhanced mass-loss from the companion, which would also lead to the associated increase in apastron flux (Koh et al. 1997; Doroshenko et al. 2010). The two later spin-up events in 2009 and 2010 seen in the GBM data were reported in Finger et al. (2010) and Wilson-Hodge et al. (2011), where the connection to the apastron flare was noted as well. Considering the similarities, the 2019 event most likely has the same origin, meaning one that is related to the formation of a transient accretion disk. This is supported by our examination of the disk formation in light of the model from Karino et al. (2019), which showed that the circularization radius of the wind matter can be larger than the magnetospheric radius in apastron, allowing for the disk to form. However, because the circularization radius is comparable to the magnetospheric radius, no extensive accretion disk can form, and accretion likely still mostly proceeds directly from wind. Indeed, the fact that the observed orbital light curve retained its typical features (i.e., pre-periastron and apastron flares) also suggests this scenario. This may explain why the spectral and temporal properties of the wind and disk states are so similar. On the other hand, observed spin-up must be powered by the disk accretion, so we conclude that while most of the accreted mass is supplied by the wind, most of the angular momentum must be transferred via an accretion disk.
The difference in the pulse profiles shown in Fig. 4 is a notable indicator of changes in the geometry of the emitting region with the binary orbital phase. The orbital variation of the pulse profile has been shown earlier by La Barbera et al. (2005) and Evangelista et al. (2010). The changes are also apparent in the energy dependence of the pulsed fraction in Fig. 5. The dip at 6.3 keV is an iron feature that Tashiro et al. (1991) explain as an indication of an extended emission region around the NS. Our comparison of the NuSTAR observations also shows that the pulsed fraction is lower closer to periastron, which is similar to the results from Endo et al. (2002). In principle, the presence of an accretion disk in 2019 could lower the pulsed fraction by increasing the emitting region on the NS surface due to deeper penetration in the magnetosphere. This is also supported by the size of emitting region on the NS surface in the disk-fed and wind-fed states obtained using the BBODYRAD normalization (see Table 2). Assuming distance to the source d = 3.53 kpc, the emission region radii were calculated to be 0.380 , 1.00
 , and 2.25
 km, for the 2014, 2015, and 2019 observations, respectively.
However, during the near-periastron observation by Endo et al. (2002) there was no indication for the spin-up implying that the lower pulsed fraction must be unrelated to the disk. This can be also illustrated by comparison of the orbital light curves as observed by Swift/BAT and Fermi/GBM instruments. Indeed, GBM measures pulsed flux, whereas BAT the total flux in the hard energy band, therefore the ratio of these fluxes can be used as a measure of the pulsed fraction (Tsygankov et al. 2018). The ratio of the folded orbital light curves from the two instruments is presented in Fig. 8 along with the orbital phases at which the NuSTAR observations were performed (here the three spin-up episodes observed in the GBM era are excluded). Indeed, close to the periastron, the GBM/BAT ratio drops, which implies an overall drop of the pulsed fraction during the pre-periastron flare regardless of the presence of an accretion disk. This matches the observed pulsed fraction close to periastron. The lower pulsed fraction may be caused by scattering in the dense wind environment or obscuration caused by the extended gas stream, which is in agreement with the pulsed fraction remaining high at the highest energies of our band. Therefore, it is unclear how much, if at all, the disk affects the pulsed fraction.
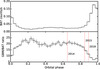 |
Fig. 8. BAT flux (top panel) and GBM/BAT flux ratio (bottom panel) folded over source orbital period (41.5 d). The vertical, dotted red lines indicate the phases at which the NuSTAR observations were performed. |
6. Conclusions
In this work, we have presented a detailed investigation of the well-known wind-fed XRP GX 301–2 using NuSTAR observation of the source during an unusual spin-up episode exhibited in January–March 2019. Because wind is not an effective source of torque to steadily accelerate the NS, it is believed that such spin-up episodes occur when a transient accretion disk forms around the NS. The start of the spin-up episode is between the periastron and apastron as with previously reported spin-up events, which is in line with the formation of the accretion disk close to the apastron. Therefore, we used two archival NuSTAR observations that were obtained during the wind-fed state in 2014 and 2015 to investigate how the presence of an accretion disk affects the temporal and spectral properties. Comparison of the spectral properties of the source in two states revealed no major differences in the phase-averaged and the phase-resolved spectra between the disk- and wind-fed states beyond possible correlation of the CRSF energy with luminosity. The pulsed fraction was revealed to be lower during the disk-fed state, but that change is most likely related to the proximity to the periastron rather than a change of the accretion mechanism. We also note that evolution of the source flux with the orbital phase remained similar to that normally observed throughout the spin-up episode, although the apastron peak in the orbital light curve was significantly stronger than usual. Based on this fact, and the absence of notable changes in the observed spectral and timing properties of the source, we conclude that the bulk of the mass powering the observed X-ray emission was accreted directly from the wind also during the spin-up episode. On the other hand, accretion of significant angular momentum unambiguously points towardhig the disk accretion, so we finally conclude that accretion directly from the wind and through a transient accretion disk takes place during the spin-up episode.
Acknowledgments
This work was supported by the Russian Science Foundation grant 19-12-00423 (SST, VD, SVM). This work was also supported by the grant from the Vilho, Yrjö and Kalle Väisälä Foundation of the Finnish Academy of Science and Letters (JM). We also acknowledge the support from the Academy of Finland travel grants 317552 (SST, JP), 324550 (SST) and 322779 (JP). The authors would like to acknowledge networking support by the COST Actions CA16214 and CA16104. We grateful to the NuSTAR team for approving the DDT observation of GX 301–2.
References
- Arnaud, K. A. 1996, in Astronomical Data Analysis Software and Systems V, eds. G. H. Jacoby, & J. Barnes, ASP Conf. Ser., 101, 17 [NASA ADS] [Google Scholar]
- Bailer-Jones, C. A. L., Rybizki, J., Fouesneau, M., Mantelet, G., & Andrae, R. 2018, AJ, 156, 58 [NASA ADS] [CrossRef] [Google Scholar]
- Basko, M. M., & Sunyaev, R. A. 1976, MNRAS, 175, 395 [NASA ADS] [CrossRef] [Google Scholar]
- Becker, P. A., Klochkov, D., Schönherr, G., et al. 2012, A&A, 544, A123 [NASA ADS] [CrossRef] [EDP Sciences] [Google Scholar]
- Bildsten, L., Chakrabarty, D., Chiu, J., et al. 1997, ApJS, 113, 367 [NASA ADS] [CrossRef] [Google Scholar]
- Doroshenko, V., Santangelo, A., Suleimanov, V., et al. 2010, A&A, 515, A10 [NASA ADS] [CrossRef] [EDP Sciences] [Google Scholar]
- Doroshenko, V., Tsygankov, S., & Santangelo, A. 2016, A&A, 589, A72 [NASA ADS] [CrossRef] [EDP Sciences] [Google Scholar]
- Endo, T., Ishida, M., Masai, K., et al. 2002, ApJ, 574, 879 [NASA ADS] [CrossRef] [Google Scholar]
- Evangelista, Y., Feroci, M., Costa, E., et al. 2010, ApJ, 708, 1663 [NASA ADS] [CrossRef] [Google Scholar]
- Filippova, E. V., Lutovinov, A. A., Shtykovsky, P. E., et al. 2004, Astron. Lett., 30, 824 [NASA ADS] [CrossRef] [Google Scholar]
- Finger, M. H., Camero-Arranz, A., Wilson-Hodge, C., & Jenke, P. 2010, ATel, 2712, 1 [NASA ADS] [Google Scholar]
- Fürst, F., Falkner, S., Marcu-Cheatham, D., et al. 2018, A&A, 620, A153 [NASA ADS] [CrossRef] [EDP Sciences] [Google Scholar]
- Harrison, F. A., Craig, W. W., Christensen, F. E., et al. 2013, ApJ, 770, 103 [NASA ADS] [CrossRef] [Google Scholar]
- Iyer, N., Mukherjee, D., Dewangan, G. C., Bhattacharya, D., & Seetha, S. 2015, MNRAS, 454, 741 [NASA ADS] [CrossRef] [Google Scholar]
- Kaper, L., Lamers, H. J. G. L. M., Ruymaekers, E., van den Heuvel, E. P. J., & Zuiderwijk, E. J. 1995, A&A, 300, 446 [NASA ADS] [Google Scholar]
- Kaper, L., van der Meer, A., & Najarro, F. 2006, A&A, 457, 595 [NASA ADS] [CrossRef] [EDP Sciences] [Google Scholar]
- Karino, S., Nakamura, K., & Taani, A. 2019, PASJ, 71, 51 [Google Scholar]
- Klochkov, D., Doroshenko, V., Santangelo, A., et al. 2012, A&A, 542, L28 [NASA ADS] [CrossRef] [EDP Sciences] [Google Scholar]
- Koh, D. T., Bildsten, L., Chakrabarty, D., et al. 1997, ApJ, 479, 933 [NASA ADS] [CrossRef] [Google Scholar]
- Kreykenbohm, I., Wilms, J., Coburn, W., et al. 2004, A&A, 427, 975 [NASA ADS] [CrossRef] [EDP Sciences] [Google Scholar]
- Krimm, H. A., Holland, S. T., Corbet, R. H. D., et al. 2013, ApJS, 209, 14 [NASA ADS] [CrossRef] [Google Scholar]
- La Barbera, A., Segreto, A., Santangelo, A., Kreykenbohm, I., & Orlandini, M. 2005, A&A, 438, 617 [NASA ADS] [CrossRef] [EDP Sciences] [Google Scholar]
- Leahy, D. A. 1991, MNRAS, 250, 310 [NASA ADS] [CrossRef] [Google Scholar]
- Leahy, D. A. 2002, A&A, 391, 219 [NASA ADS] [CrossRef] [EDP Sciences] [Google Scholar]
- Leahy, D. A., & Kostka, M. 2008, MNRAS, 384, 747 [NASA ADS] [CrossRef] [Google Scholar]
- Leahy, D. A., Darbro, W., Elsner, R. F., et al. 1983, ApJ, 266, 160 [NASA ADS] [CrossRef] [Google Scholar]
- Lutovinov, A. A., & Tsygankov, S. S. 2009, Astron. Lett., 35, 433 [NASA ADS] [CrossRef] [Google Scholar]
- Meegan, C., Lichti, G., Bhat, P. N., et al. 2009, ApJ, 702, 791 [NASA ADS] [CrossRef] [Google Scholar]
- Mihara, T., Makishima, K., & Nagase, F. 1995, Am. Astron. Soc. Meeting Abs., 187, 104.03 [NASA ADS] [Google Scholar]
- Mihara, T., Makishima, K., & Nagase, F. 1998, Adv. Space Res., 22, 987 [NASA ADS] [CrossRef] [Google Scholar]
- Morrison, R., & McCammon, D. 1983, ApJ, 270, 119 [NASA ADS] [CrossRef] [Google Scholar]
- Mukherjee, U., & Paul, B. 2004, A&A, 427, 567 [NASA ADS] [CrossRef] [EDP Sciences] [Google Scholar]
- Mushtukov, A. A., Suleimanov, V. F., Tsygankov, S. S., & Poutanen, J. 2015, MNRAS, 447, 1847 [NASA ADS] [CrossRef] [Google Scholar]
- Nakajima, M., Mihara, T., Makishima, K., & Niko, H. 2006, ApJ, 646, 1125 [NASA ADS] [CrossRef] [Google Scholar]
- Parkes, G. E., Mason, K. O., Murdin, P. G., & Culhane, J. L. 1980, MNRAS, 191, 547 [NASA ADS] [CrossRef] [Google Scholar]
- Pravdo, S. H., & Ghosh, P. 2001, ApJ, 554, 383 [NASA ADS] [CrossRef] [Google Scholar]
- Pravdo, S. H., Day, C. S. R., Angelini, L., et al. 1995, ApJ, 454, 872 [NASA ADS] [CrossRef] [Google Scholar]
- Soker, N. 2004, MNRAS, 350, 1366 [NASA ADS] [CrossRef] [Google Scholar]
- Staubert, R., Shakura, N. I., Postnov, K., et al. 2007, A&A, 465, L25 [NASA ADS] [CrossRef] [EDP Sciences] [Google Scholar]
- Staubert, R., Trümper, J., Kendziorra, E., et al. 2019, A&A, 622, A61 [NASA ADS] [CrossRef] [EDP Sciences] [Google Scholar]
- Suchy, S., Fürst, F., Pottschmidt, K., et al. 2012, ApJ, 745, 124 [NASA ADS] [CrossRef] [Google Scholar]
- Sunyaev, R. A., & Titarchuk, L. G. 1980, A&A, 500, 167 [NASA ADS] [Google Scholar]
- Tanaka, Y. 1986, in Radiation Hydrodynamics in Stars and Compact Objects, eds. D. Mihalas, & K. H. A. Winkler (Berlin: Springer-Verlag), Lect. Notes Phys., 255, 198 [NASA ADS] [CrossRef] [Google Scholar]
- Tashiro, M., Makishima, K., Ohashi, T., Sakao, T., & Sansom, A. E. 1991, MNRAS, 252, 156 [NASA ADS] [CrossRef] [Google Scholar]
- Treuz, S., Doroshenko, V., Santangelo, A., & Staubert, R. 2018, Arxiv e-print [arXiv:1806.11397] [Google Scholar]
- Tsygankov, S. S., Lutovinov, A. A., Churazov, E. M., & Sunyaev, R. A. 2006, MNRAS, 371, 19 [NASA ADS] [CrossRef] [Google Scholar]
- Tsygankov, S. S., Lutovinov, A. A., & Serber, A. V. 2010, MNRAS, 401, 1628 [NASA ADS] [CrossRef] [Google Scholar]
- Tsygankov, S. S., Doroshenko, V., Mushtukov, A. A., Lutovinov, A. A., & Poutanen, J. 2018, MNRAS, 479, L134 [NASA ADS] [CrossRef] [Google Scholar]
- Wachter, K., Leach, R., & Kellogg, E. 1979, ApJ, 230, 274 [Google Scholar]
- Waisberg, I., Dexter, J., Pfuhl, O., et al. 2017, ApJ, 844, 72 [NASA ADS] [CrossRef] [Google Scholar]
- White, N. E., Mason, K. O., Huckle, H. E., Charles, P. A., & Sanford, P. W. 1976, ApJ, 209, L119 [NASA ADS] [CrossRef] [Google Scholar]
- Willingale, R., Starling, R. L. C., Beardmore, A. P., Tanvir, N. R., & O’Brien, P. T. 2013, MNRAS, 431, 394 [NASA ADS] [CrossRef] [Google Scholar]
- Wilms, J., Allen, A., & McCray, R. 2000, ApJ, 542, 914 [NASA ADS] [CrossRef] [Google Scholar]
- Wilson-Hodge, C., Cherry, M. L., Case, G. L., et al. 2011, Fast X-ray Timing and Spectroscopy at Extreme Count Rates (HTRS 2011), 43 [CrossRef] [Google Scholar]
All Tables
All Figures
|
Fig. 1. X-ray light curves of GX 301–2 extracted from three NuSTAR observations in energy range 3–79 keV. |
| In the text | |
|
Fig. 2. Upper panel: pulse frequency of GX 301–2 observed with GBM Pulsar Project. Lower panel: X-ray count rate seen by Swift/BAT in energy range 15–50 keV. Dashed blue lines show the dates when the NuSTAR observations were performed. In each panel the recent spin-up episode is zoomed-in, with the periastron passages marked with the dashed red lines and the apastron passages shown with the dotted blue lines. |
| In the text | |
|
Fig. 3. Top panels: pulse profiles of GX 301–2 in five different energy bands 3–7, 7–18, 18–30, 30–50, and 50–79 keV (from top to bottom) obtained by NuSTAR observations in 2014 (red) and 2015 (black) during the wind accretion phases. The fluxes are normalized by the mean flux in each energy band. The zero phase was chosen to maximize the CCF. Bottom panels: ratio of the GX 301–2 pulse profiles during the wind-fed states (wind/wind) obtained using 2014 and 2015 observations in the energy bands 3–7, 18–30, and 30–50 keV. The ratio of unity is shown by the horizontal blue line. |
| In the text | |
|
Fig. 4. Same as Fig. 3, but for observations in 2014 (red) and 2019 (black) in which NS was accreting from wind and disk, respectively. |
| In the text | |
|
Fig. 5. Energy dependence of pulsed fraction of GX 301–2 obtained from NuSTAR observations in 2014 (red crosses), 2015 (black crosses), and 2019 (blue crosses). The vertical dashed line indicates the centroid of the iron Kα emission line. |
| In the text | |
|
Fig. 6. Upper panels: broadband spectrum of GX 301–2 obtained by FPMA and FPMB/NuSTAR (red and black crosses) in 2019, 2015, and 2014 together with best-fit model constant × tbabs × tbpcf × gabs × gabs × (bbodyrad + fdcut + gaussian) (solid line). Different continuum components and the iron line are shown with dashed lines. Bottom panels: residuals from best-fit model in units of standard deviations. |
| In the text | |
|
Fig. 7. Spectral model parameter variations as function of pulse phase. The crosses from the uppermost to the lowest panel show: (a) first cyclotron line energy (CRSF1), (b) first cyclotron line depth, (c) second cyclotron line energy (CRSF2), (d) second cyclotron line depth, (e) photon index, (f) blackbody temperature, (g) partial covering column density NH,2, (h) cutoff energy, and (i) folding energy. The gray line in each panel indicates the averaged pulse profile in the energy range 3–79 keV. |
| In the text | |
|
Fig. 8. BAT flux (top panel) and GBM/BAT flux ratio (bottom panel) folded over source orbital period (41.5 d). The vertical, dotted red lines indicate the phases at which the NuSTAR observations were performed. |
| In the text | |
Current usage metrics show cumulative count of Article Views (full-text article views including HTML views, PDF and ePub downloads, according to the available data) and Abstracts Views on Vision4Press platform.
Data correspond to usage on the plateform after 2015. The current usage metrics is available 48-96 hours after online publication and is updated daily on week days.
Initial download of the metrics may take a while.