Fig. 3.
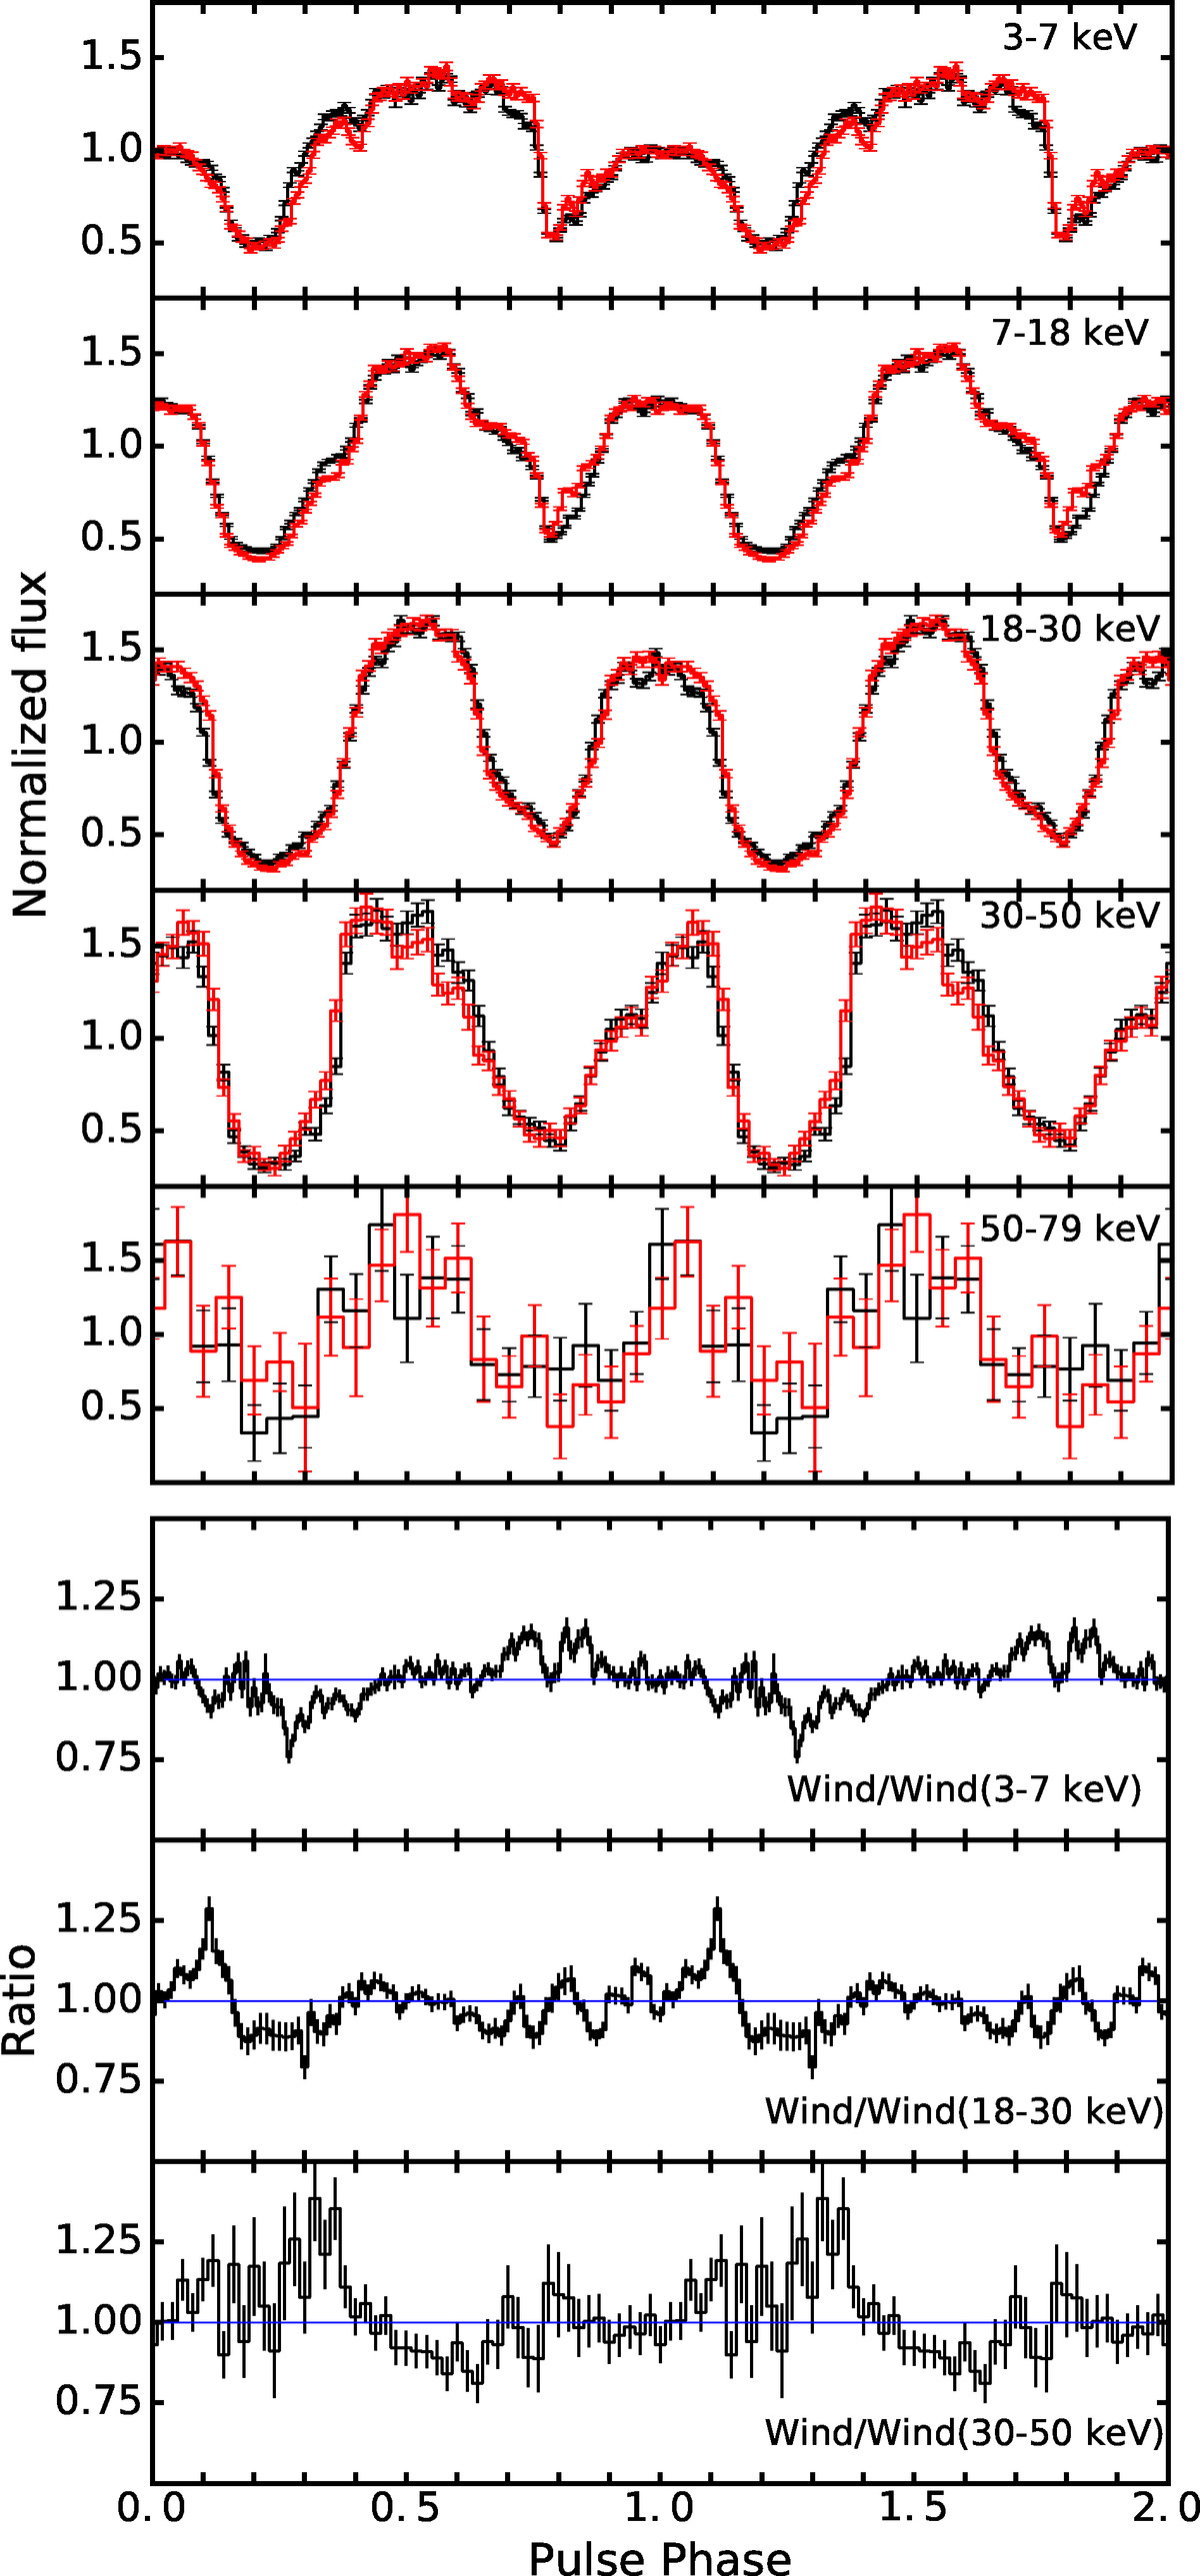
Top panels: pulse profiles of GX 301–2 in five different energy bands 3–7, 7–18, 18–30, 30–50, and 50–79 keV (from top to bottom) obtained by NuSTAR observations in 2014 (red) and 2015 (black) during the wind accretion phases. The fluxes are normalized by the mean flux in each energy band. The zero phase was chosen to maximize the CCF. Bottom panels: ratio of the GX 301–2 pulse profiles during the wind-fed states (wind/wind) obtained using 2014 and 2015 observations in the energy bands 3–7, 18–30, and 30–50 keV. The ratio of unity is shown by the horizontal blue line.
Current usage metrics show cumulative count of Article Views (full-text article views including HTML views, PDF and ePub downloads, according to the available data) and Abstracts Views on Vision4Press platform.
Data correspond to usage on the plateform after 2015. The current usage metrics is available 48-96 hours after online publication and is updated daily on week days.
Initial download of the metrics may take a while.