Fig. 7.
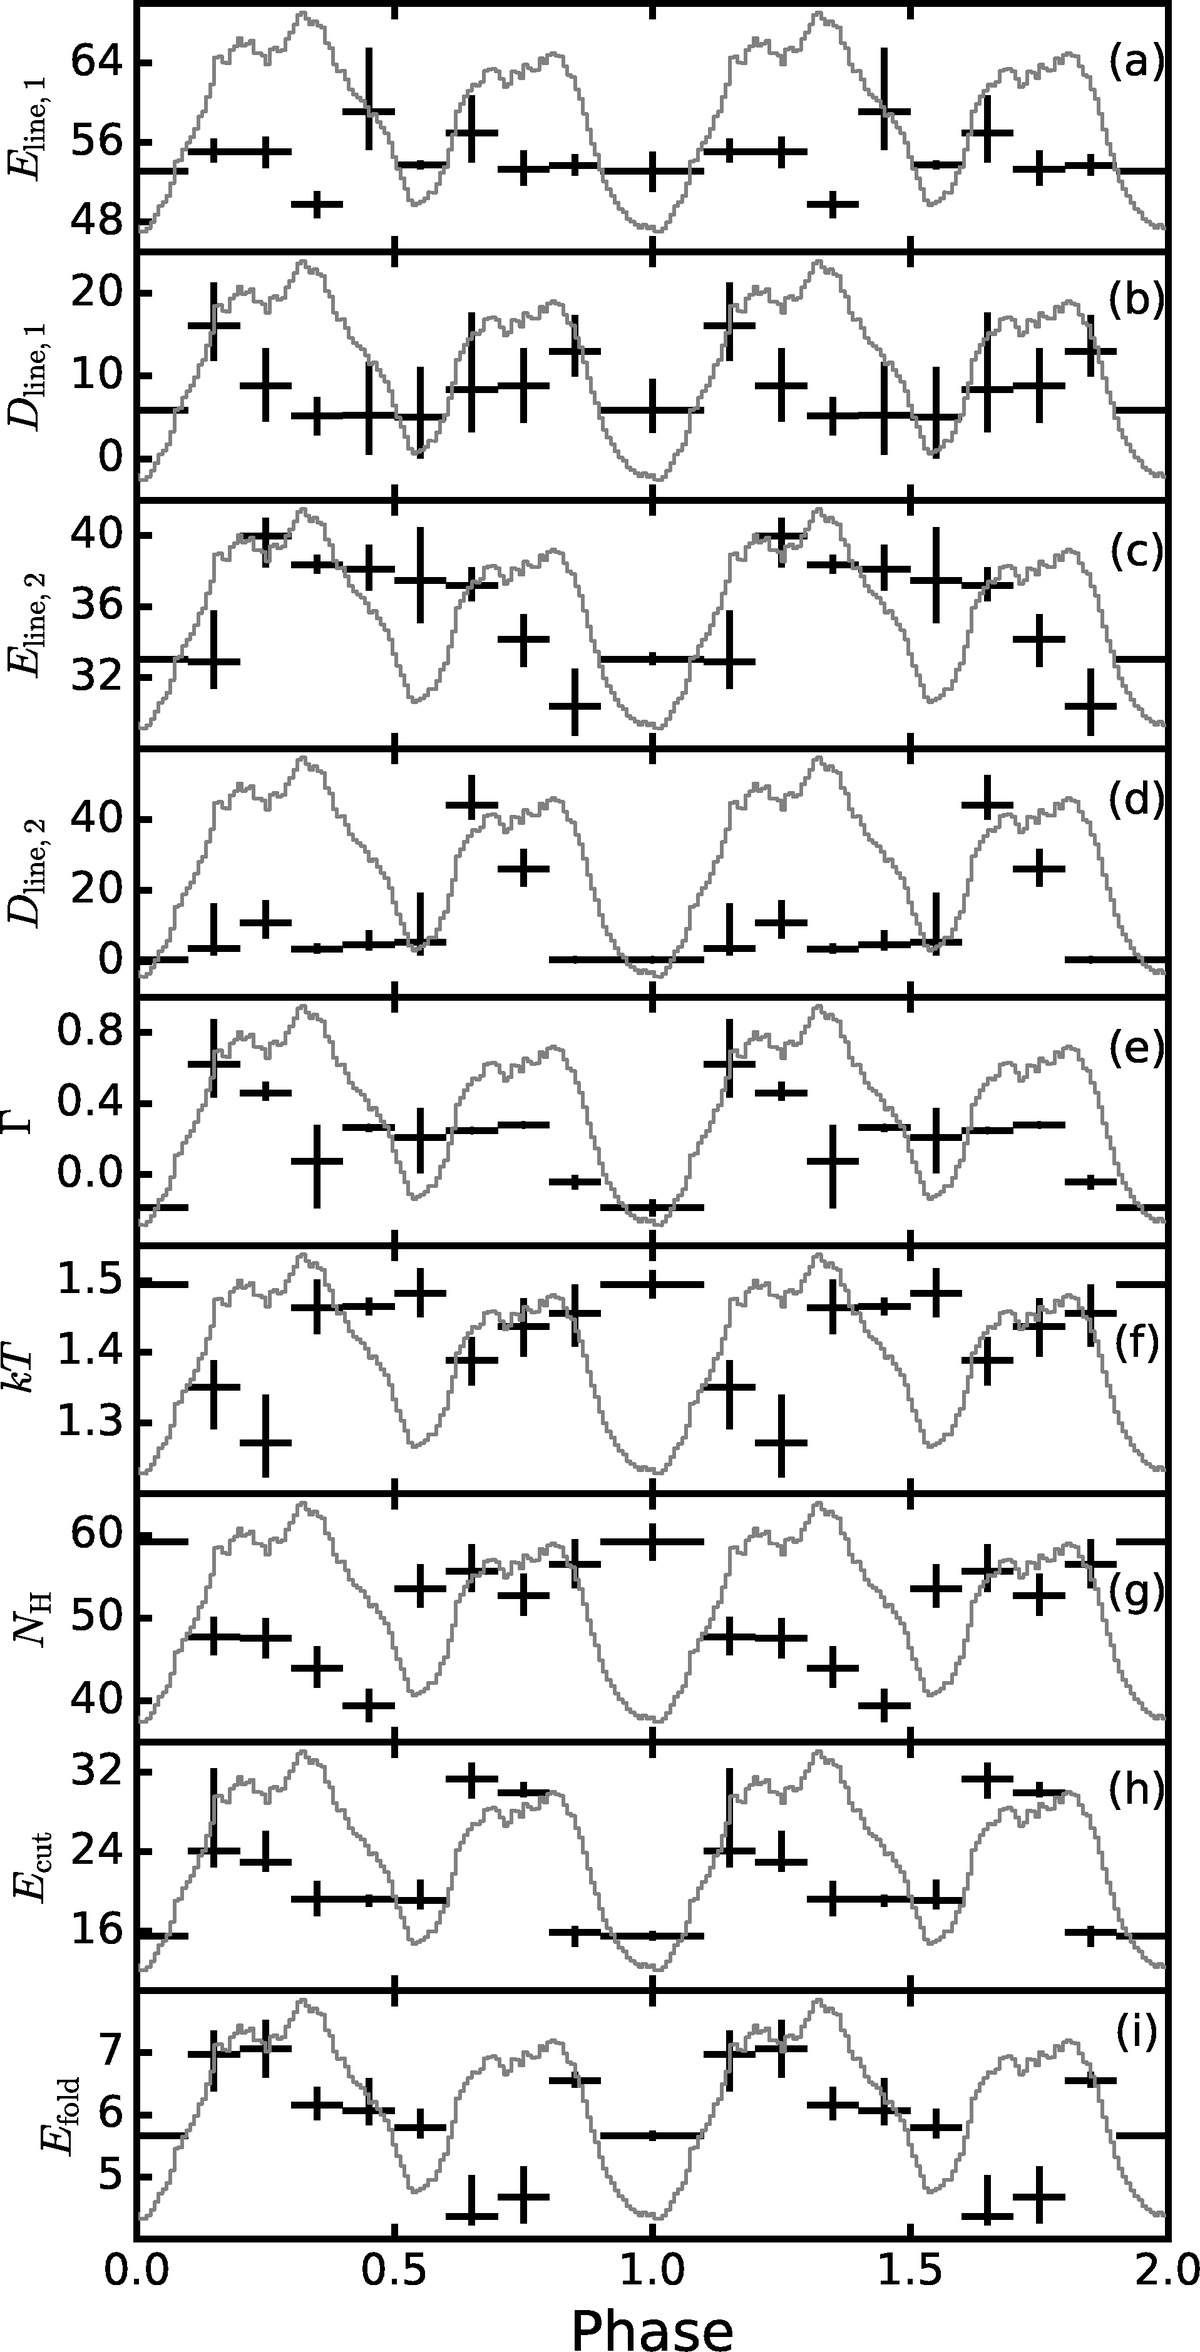
Spectral model parameter variations as function of pulse phase. The crosses from the uppermost to the lowest panel show: (a) first cyclotron line energy (CRSF1), (b) first cyclotron line depth, (c) second cyclotron line energy (CRSF2), (d) second cyclotron line depth, (e) photon index, (f) blackbody temperature, (g) partial covering column density NH,2, (h) cutoff energy, and (i) folding energy. The gray line in each panel indicates the averaged pulse profile in the energy range 3–79 keV.
Current usage metrics show cumulative count of Article Views (full-text article views including HTML views, PDF and ePub downloads, according to the available data) and Abstracts Views on Vision4Press platform.
Data correspond to usage on the plateform after 2015. The current usage metrics is available 48-96 hours after online publication and is updated daily on week days.
Initial download of the metrics may take a while.