Free Access
Fig. 8.
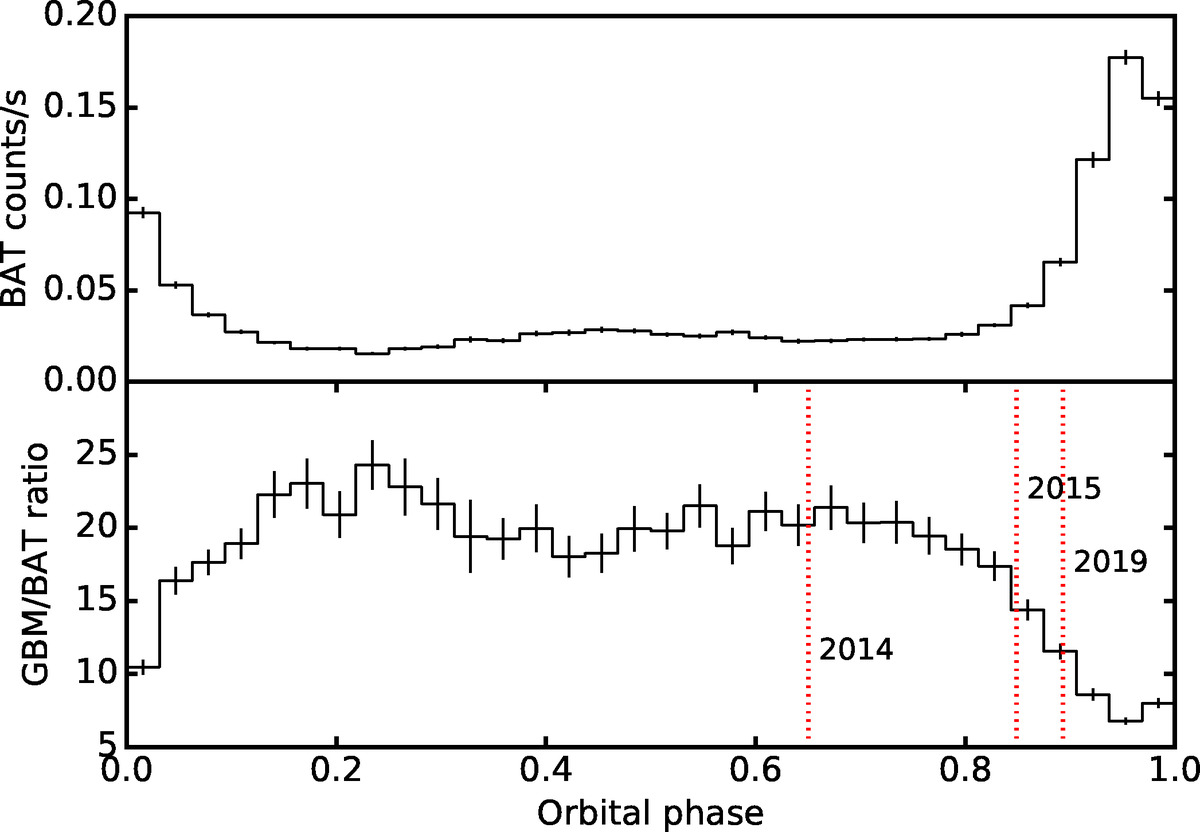
BAT flux (top panel) and GBM/BAT flux ratio (bottom panel) folded over source orbital period (41.5 d). The vertical, dotted red lines indicate the phases at which the NuSTAR observations were performed.
Current usage metrics show cumulative count of Article Views (full-text article views including HTML views, PDF and ePub downloads, according to the available data) and Abstracts Views on Vision4Press platform.
Data correspond to usage on the plateform after 2015. The current usage metrics is available 48-96 hours after online publication and is updated daily on week days.
Initial download of the metrics may take a while.