Fig. 2.
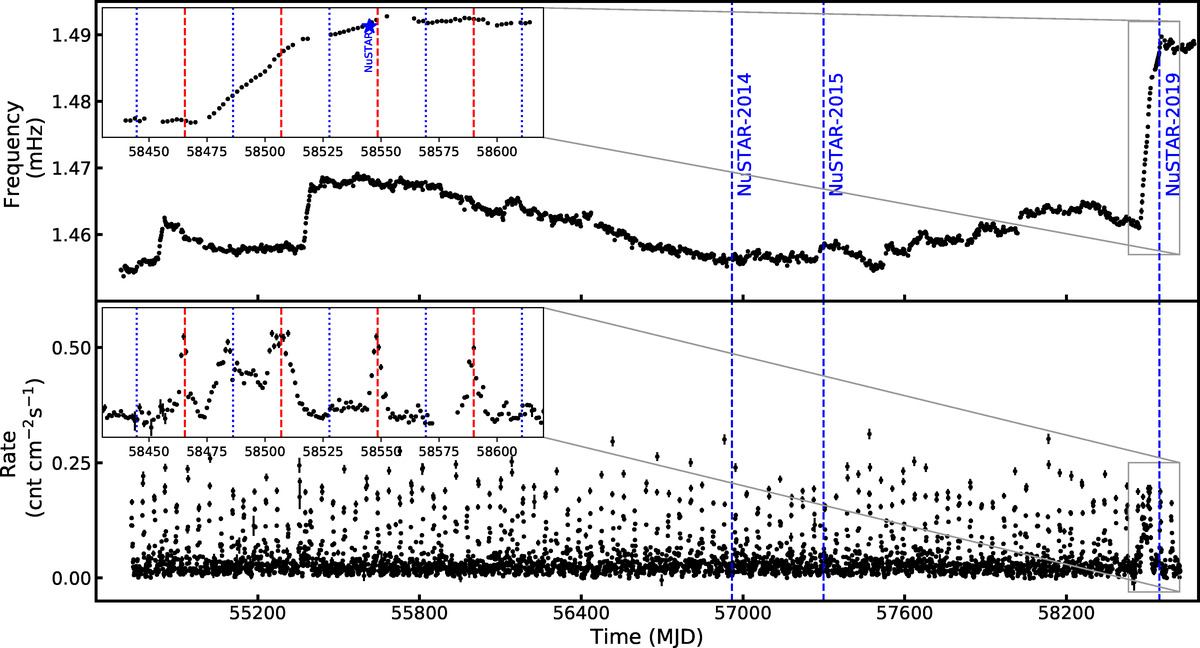
Upper panel: pulse frequency of GX 301–2 observed with GBM Pulsar Project. Lower panel: X-ray count rate seen by Swift/BAT in energy range 15–50 keV. Dashed blue lines show the dates when the NuSTAR observations were performed. In each panel the recent spin-up episode is zoomed-in, with the periastron passages marked with the dashed red lines and the apastron passages shown with the dotted blue lines.
Current usage metrics show cumulative count of Article Views (full-text article views including HTML views, PDF and ePub downloads, according to the available data) and Abstracts Views on Vision4Press platform.
Data correspond to usage on the plateform after 2015. The current usage metrics is available 48-96 hours after online publication and is updated daily on week days.
Initial download of the metrics may take a while.