| Issue |
A&A
Volume 575, March 2015
|
|
|---|---|---|
| Article Number | L13 | |
| Number of page(s) | 6 | |
| Section | Letters | |
| DOI | https://doi.org/10.1051/0004-6361/201525762 | |
| Published online | 03 March 2015 | |
Online material
Appendix A: Additional figures
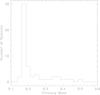 |
Fig. A.1
Distribution of primary mass in the sample of Brown et al. (2013). The sample contains many objects with primary mass equal to 0.17 M⊙. |
| Open with DEXTER | |
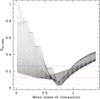 |
Fig. A.2
Maximum deviation between the observed sample with N = 54 and a synthetic sample containing N′ = 10 000 objects, with the companion mass being distributed as a Gaussian with a mean mass as given by the abscissa. The blue dotted line is drawn at D∗ = 0.2628: all simulations with a higher value of the estimator can be rejected at the 99.9% level as being drawn from the same population as the observed distribution. The magenta dashed line is drawn at D∗ = 0.1274 and provide a 1σ estimate of the allowed parameter range, while the red solid line is drawn at D∗ = 0.0506. |
| Open with DEXTER | |
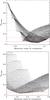 |
Fig. A.3
Top: maximum deviation as a function of the highest mass of the companion if the latter is uniformly distributed between a lowest and highest mass. Bottom: the same, but as a function of the lowest mass. The lines are drawn at the same value of D∗ as in Fig. A.2. |
| Open with DEXTER | |
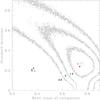 |
Fig. A.4
Reduced χ2 map in the mean companion mass vs. standard deviation for an assumed Gaussian functional form of the companion mass distribution – contours are shown at levels of 1, 1.5, 2, and 2.5. The red dot shows the position of the best fit of Andrews et al. (2014). The χ2 map confirms the result that was obtained with the K-S statistics. |
| Open with DEXTER | |
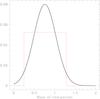 |
Fig. A.5
Comparison between the two best functional forms that lead to the lowest values of D∗: a Gaussian distribution with μ = 0.76 M⊙ and σ = 0.27 M⊙ (solid black line) and a uniform distribution with M2,l = 0.25 M⊙ and M2,u = 1.28 M⊙ (dotted red line). |
| Open with DEXTER | |
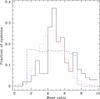 |
Fig. A.6
Distribution of the mass ratios as determined by the Richardson-Lucy algorithm (solid black line) for all systems with a primary mass below 0.2 M⊙, and as obtained for the best fits with a Gaussian (red dotted line) and a uniform (blue dashed line) distribution of companions. |
| Open with DEXTER | |
© ESO, 2015
Current usage metrics show cumulative count of Article Views (full-text article views including HTML views, PDF and ePub downloads, according to the available data) and Abstracts Views on Vision4Press platform.
Data correspond to usage on the plateform after 2015. The current usage metrics is available 48-96 hours after online publication and is updated daily on week days.
Initial download of the metrics may take a while.