Fig. A.2
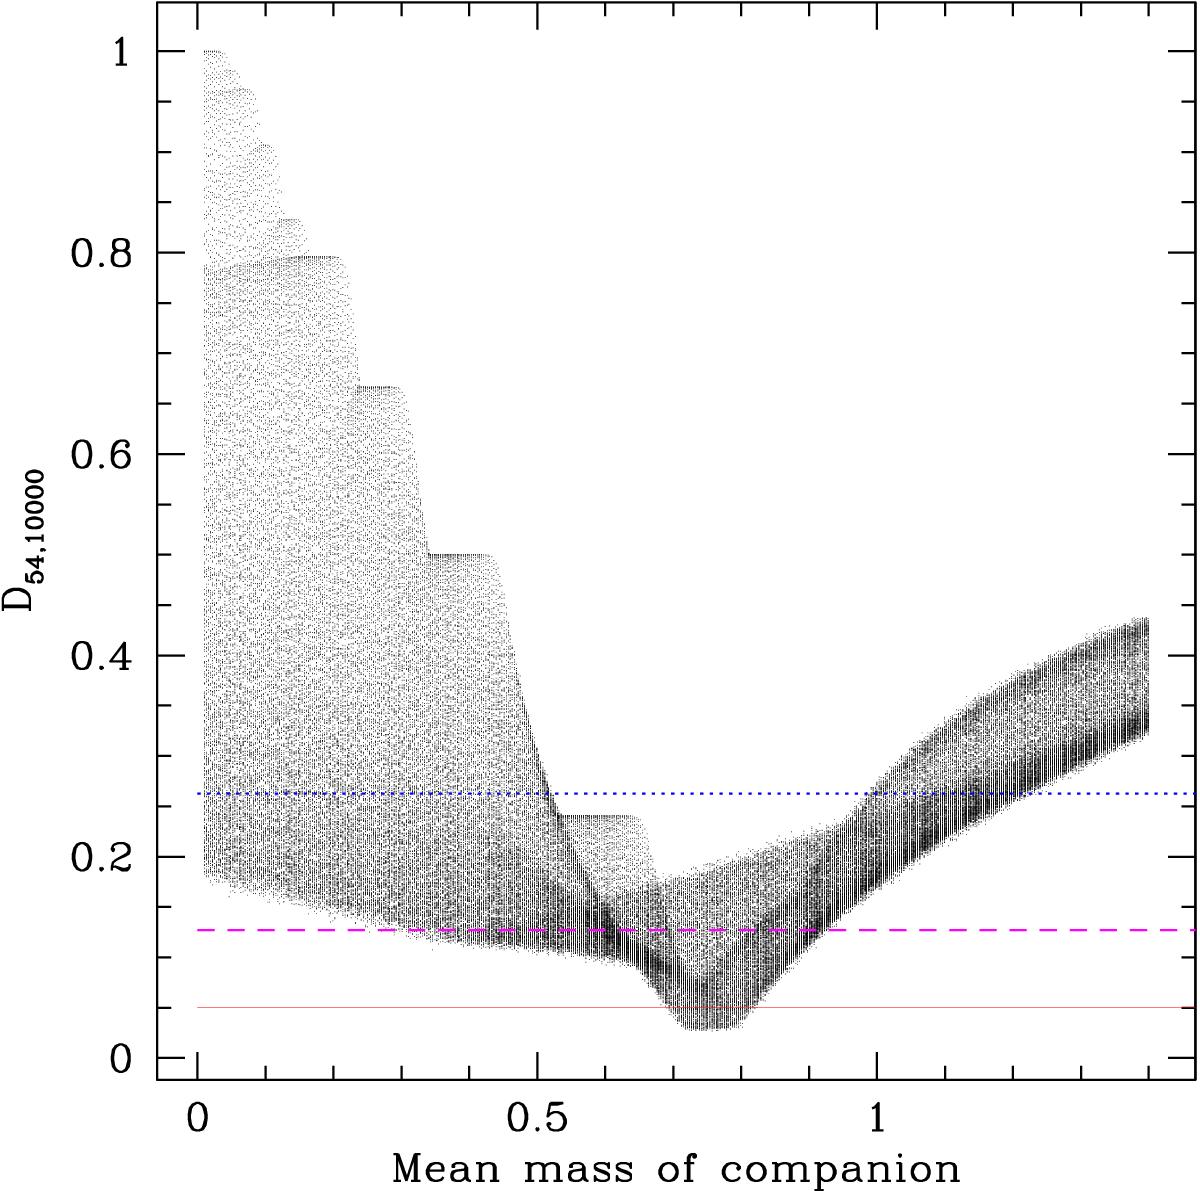
Maximum deviation between the observed sample with N = 54 and a synthetic sample containing N′ = 10 000 objects, with the companion mass being distributed as a Gaussian with a mean mass as given by the abscissa. The blue dotted line is drawn at D∗ = 0.2628: all simulations with a higher value of the estimator can be rejected at the 99.9% level as being drawn from the same population as the observed distribution. The magenta dashed line is drawn at D∗ = 0.1274 and provide a 1σ estimate of the allowed parameter range, while the red solid line is drawn at D∗ = 0.0506.
Current usage metrics show cumulative count of Article Views (full-text article views including HTML views, PDF and ePub downloads, according to the available data) and Abstracts Views on Vision4Press platform.
Data correspond to usage on the plateform after 2015. The current usage metrics is available 48-96 hours after online publication and is updated daily on week days.
Initial download of the metrics may take a while.