Fig. A.4
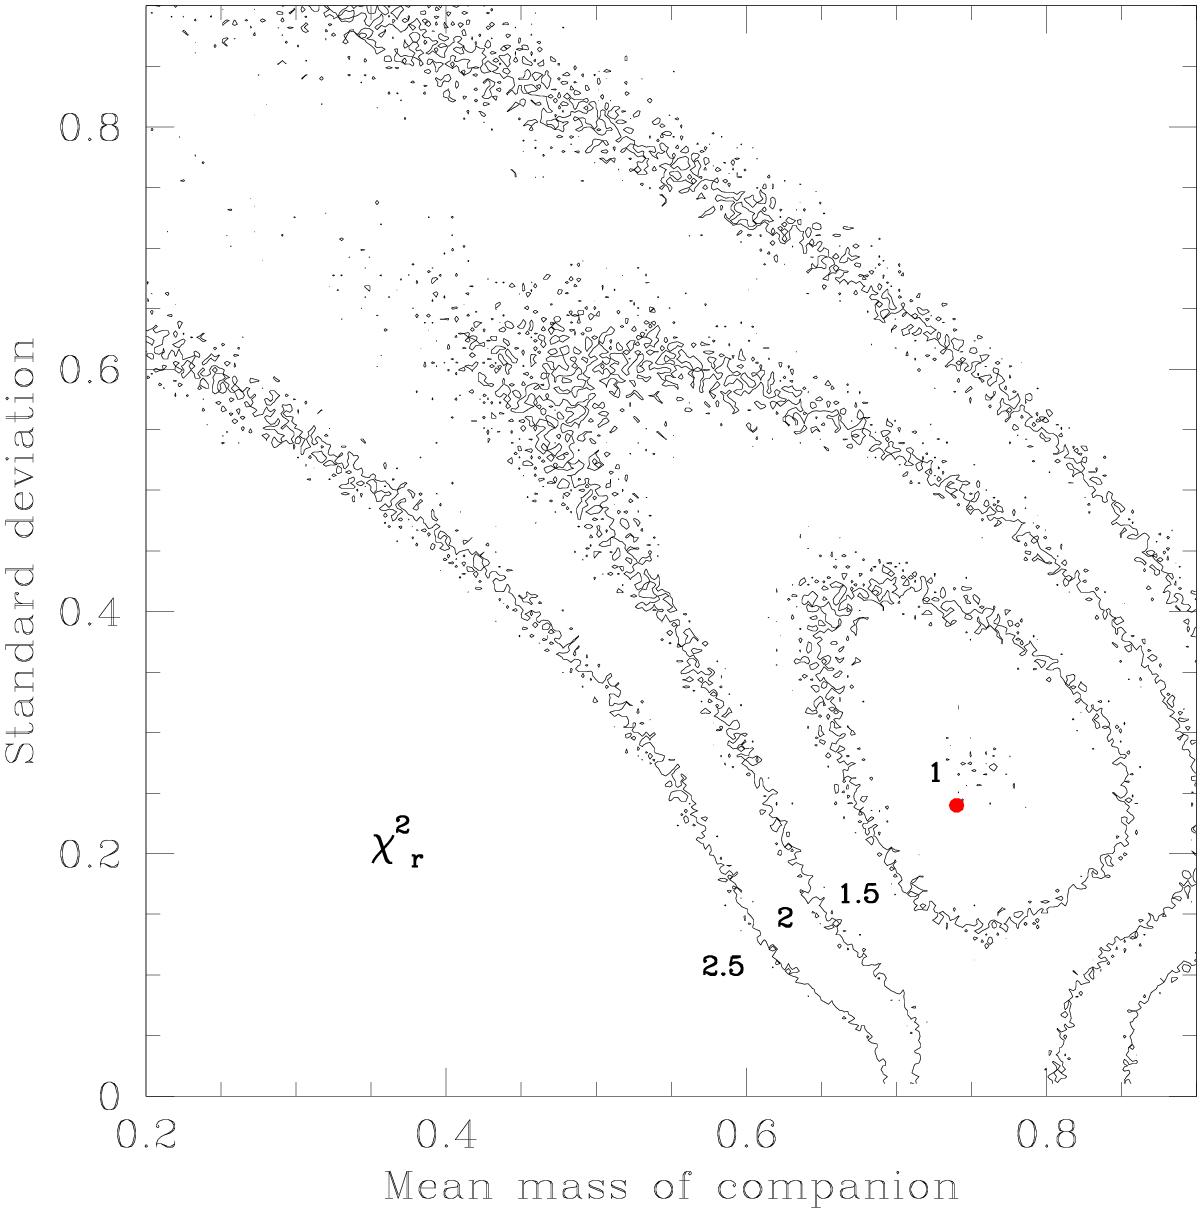
Reduced χ2 map in the mean companion mass vs. standard deviation for an assumed Gaussian functional form of the companion mass distribution – contours are shown at levels of 1, 1.5, 2, and 2.5. The red dot shows the position of the best fit of Andrews et al. (2014). The χ2 map confirms the result that was obtained with the K-S statistics.
Current usage metrics show cumulative count of Article Views (full-text article views including HTML views, PDF and ePub downloads, according to the available data) and Abstracts Views on Vision4Press platform.
Data correspond to usage on the plateform after 2015. The current usage metrics is available 48-96 hours after online publication and is updated daily on week days.
Initial download of the metrics may take a while.