Free Access
Fig. A.6
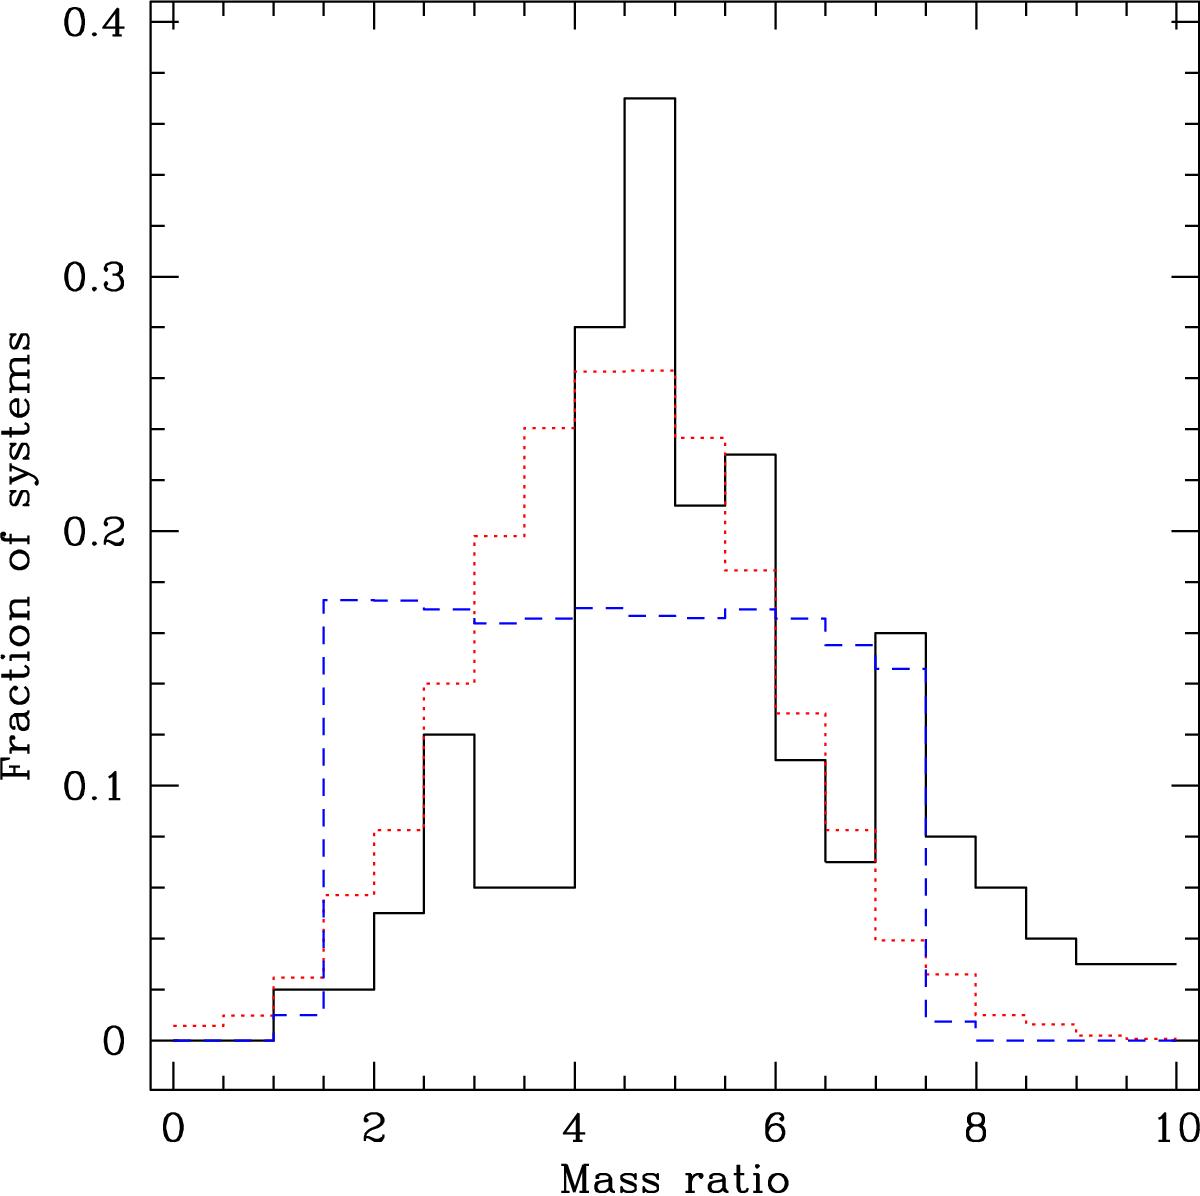
Distribution of the mass ratios as determined by the Richardson-Lucy algorithm (solid black line) for all systems with a primary mass below 0.2 M⊙, and as obtained for the best fits with a Gaussian (red dotted line) and a uniform (blue dashed line) distribution of companions.
Current usage metrics show cumulative count of Article Views (full-text article views including HTML views, PDF and ePub downloads, according to the available data) and Abstracts Views on Vision4Press platform.
Data correspond to usage on the plateform after 2015. The current usage metrics is available 48-96 hours after online publication and is updated daily on week days.
Initial download of the metrics may take a while.