| Issue |
A&A
Volume 573, January 2015
|
|
|---|---|---|
| Article Number | A19 | |
| Number of page(s) | 39 | |
| Section | Interstellar and circumstellar matter | |
| DOI | https://doi.org/10.1051/0004-6361/201424669 | |
| Published online | 10 December 2014 | |
Online material
Appendix A: SEDs and photometry tables for all the YSO observed by Herschel
This appendix contains full collection of SEDs of objects observed with Herschel, together with the complete Herschel photometry of the sources9. The first part (Table A.1, Figs. A.1 to A.3) includes the sources previously known and confirmed from our spectroscopic surveys (Sicilia-Aguilar et al. 2005, 2006b; SA13). The second part includes objects identified as YSO via Spitzer, Hα photometry, and/or X-ray observations (Table A.2, Fig. A.4). Table A.3 contains the upper limits for sources with disks identified via optical spectroscopy, whose SEDs are displayed in Figs. A.5−A.8. Table A.4 contains the upper limits for sources with disks from Hα (B11), X-ray (M09; G12), and Spitzer (MC09) surveys, whose SEDs are displayed in Fig. A.9. Only sources with confirmed or potential IR excesses and significant upper limits (those that impose some contraints on the source SED) are considered. Most of the sources located within strong nebular emission in and near the IC 1396 A globule are excluded from the tables and figures, as their upper limits are typically several orders of magnitude higher than any reasonable value expected from their Spitzer data. A few objects with uncertain mid-IR excesses are also listed as upper limits.
The optical data for the sources was compiled from the existing literature (Sicilia-Aguilar et al. 2005, 2010; SA13; G12; B11; M09). Sources lacking this information in their original paper were searched for in our optical photometry databases, which are presented in detail in Sicilia-Aguilar et al. (2005; including VRI data from the Fred Lawrence Whipple Observatory) and Sicilia-Aguilar et al. (2010; with UVRI data from LAICA/3.5 m Calar Alto Telescope). For very bright sources such as HD 206267 and CCDM J2137+5734, the optical data was obtained from SIMBAD. The sources were also matched to the 2MASS catalog (Cutri et al. 2003) to obtain JHK photometry. The Spitzer data was compiled from the literature for the optical spectroscopy members (SA13). For the remaining candidates, we re-reduced the existing Spitzer data following the same procedures as in SA13, and also obtained the WISE counterparts from the WISE All-Sky Catalog (Wright et al. 2010) for objects without Spitzer data. All the plotted SEDs are corrected for the measured extinction, when available, or using the cluster average or best-fit extinction to the photospheric data of the star (if no measurement of AV is published).
The detection of photospheric fluxes at 70 μm is limited to the O star HD 206267, which makes all upper limits on diskless intermediate- and low-mass stars irrelevant. Objects such as cold TD or debris disks (with excesses only at 70 μm and beyond) around low-mass stars would typically remain undetected, so potential excesses around otherwise diskless objects must be handled with care, as they can easily be the result of contamination by cloud emission or background, unrelated objects.
Some of the disks are labelled as “marginal detections”. These are cases where we observe spatially variable, patchy, sky background in the proximities of the source and with similar bightness as we would expect from source itself. This could be a sign of mismatch or contamination, even if visual inspection reveals the presence of a point-like source. For them, we consider that the flux of the object, even though more uncertain than in clear detections as it could be contaminated, is probably close to the observed “marginal detection”. This distinguishes marginal detections from plain upper limits, where there is no hint of point source emission at the location of the source and thus the flux at the corresponding wavelength could in principle be much lower than the actual upper limits. For all other analysis throughout the paper, marginal detections are considered as upper limits.
PACS photometry of previously known CepOB2 members identified by optical spectroscopy.
PACS photometry of CepOB2 members identified by Spitzer/X-ray/Hα photometry.
PACS upper limits for previously known CepOB2 members with disks.
PACS upper limits of CepOB2 members identified by Spitzer/X-ray/Hα photometry.
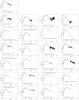 |
Fig. A.1
SEDs of the objects detected with Herschel, including available optical, Spitzer (IRAC/MIPS photometry and IRS spectra), WISE, and IRAM 1.3 mm data. The first row contains the only NGC 7160 member detected with Herschel (01-580), the rest belong to Tr 37. Filled symbols mark detections at different wavelengths. Errorbars are shown in blue for both photometry points (often smaller than the symbols) and the IRS spectra. Upper limits are marked as inverted open triangles. Marginal detections (close to 3σ or affected by nebulosity) are marked as open circles. The information about spectral types and Hα emission from the literature is also listed. A photospheric MARCS model is displayed as a dotted line for comparison. |
| Open with DEXTER | |
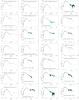 |
Fig. A.2
SEDs of the objects detected with Herschel (continuation). All objects belong to Tr 37. Symbols as in Fig. A.1. |
| Open with DEXTER | |
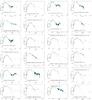 |
Fig. A.3
SEDs of the objects detected with Herschel (continuation). All objects belong to Tr 37. Symbols as in Fig. A.1. |
| Open with DEXTER | |
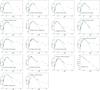 |
Fig. A.4
SEDs of objects without optical confirmation (see Table A.2) detected with Herschel. Available optical, Spitzer (IRAC/MIPS photometry and IRS spectra), and WISE, data are shown as filled dots. Errorbars are shown (although they are often smaller than the symbols). Upper limits are marked as inverted open triangles. Marginal detections (close to 3σ or affected by nebulosity) are marked as open circles. A photospheric MARCS model is displayed for comparison. Approximate spectral types (except for HD 206267 are estimated from the comparison with the MARCS model, assuming the typical cluster extinctions. |
| Open with DEXTER | |
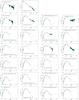 |
Fig. A.5
SEDs of the objects with upper limits only. The first two objects are in the NGC 7160 cluster, the rest are in Tr 37. Only objects with confirmed disks (Spitzer excesses) are displayed. Filled symbols mark detections at different wavelengths. Errorbars are shown in blue for both photometry points (often smaller than the symbols) and the IRS spectra. Upper limits are marked as inverted open triangles. Marginal detections (close to 3σ or affected by nebulosity) are marked as open circles. The information about spectral types and Hα emission from the literature is also listed. A photospheric MARCS model is displayed for comparison. |
| Open with DEXTER | |
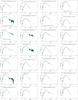 |
Fig. A.6
SEDs of the objects with upper limits only. Symbols as in Fig. A.5. |
| Open with DEXTER | |
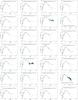 |
Fig. A.7
SEDs of the objects with upper limits only. Symbols as in Fig. A.5. |
| Open with DEXTER | |
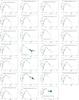 |
Fig. A.8
SEDs of the objects with upper limits only. Symbols as in Fig. A.5. |
| Open with DEXTER | |
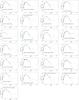 |
Fig. A.9
SEDs of the objects with Herschel upper limits and without optical spectroscopy confirmation (see Table A.4). Only objects with evidence of a disk at other wavelengths and with significant upper limits (i.e. not contaminated by nearby bright objects/cloud) are listed here. Approximate spectral types (from SED fitting) are listed for the relevant objects. Symbols as in Fig. A.5. |
| Open with DEXTER | |
Appendix B: RADMC models for disks with various disk structures
The following tables list the properties of the disks models used to interpret the α spectral indices. The disk models do not reproduce any of the CepOB2 members in particular. Instead, we explore the parameter space that samples the behaviours observed in different cluster members. The models are thus an extension of the parameter space explored in Sicilia-Aguilar et al. (2011) for a subsample of representative disks with various SED morphologies. All models were constructed using the 2D radiative-transfer MonteCarlo code RADMC (Dullemond & Dominik 2004) for a standard star with Teff = 4275 K, R∗ = 1.7 R⊙, and M∗ = 1 M⊙ with a 200 AU disk, seen at a 45 degree inclination. The disks are axisymmetric (2D) but the photon packages are followed in 3D. The RADMC code assumes a disk with well-mixed dust and gas and a standard gas-to-dust ratio of 100. The dust temperatures of all species are the same. The inner rim of the disk is either fixed at the dust destruction temperature (1500 K) or moved to cooler temperatures to simulate inner holes. A small amount of small dust grains is added at this location to reproduce the observed silicate features. The models can be either vertically iterated to reproduce hydrostatic equilibrium (which washes out any predetermined structure parameters such as vertical pressure scale height H vs. radius or disk thickness, requiring that gas and dust are well-mixed), or to reproduce cases where gas and dust are not well-coupled or there are additional variations in the vertical disk structure. In this latter case, we modify the thickness of the disk (H/R ∝ Rq) at the outer disk radius ((H/R)out) to reproduce thicker/thinner disks, and modify the exponent q to obtain various degrees of flaring or global settling. For the dust content, we assume standard amorphous silicate grains with a grain size distribution between amin–amax with a power-law dependency n(a) ∝ a− p, which can be taken as the standard collisional distribution (p = −3.5) or changed. We also include 25% of amorphous carbon grains with the same grain distribution as a source of continuum opacity. The grain properties are maintained through the whole disk unless radial variations are included (such as adding small grain populations in the inner disk to reproduce pre-transitional and transitional disks).
Summary of the RADMC models.
SED α spectral indices for the RADMC models at various wavelengths.
Appendix C: Notes on individual objects
Here we present a comparison of the fluxes predicted by our previous, Spitzer-based disk models (Sicilia-Aguilar et al. 2011; SA13) and the actual Herschel observations. Herschel/PACS fluxes and upper limits are highly consistent with the Spitzer (MIPS/IRS) data. The measured far-IR fluxes are in good agreement with our model predictions based on optical, Spitzer, and millimetre data, although some cases present higher or lower fluxes than expected. Extended emission at 160 μm likely affects the fluxes of objects like 72−1427 (Fig. A.1), 21374763+573242323, 12-1091 (Fig. A.2), and probably others like 14-1017 (Fig. A.1), 213945860+573051704, and 21400451+5728363 (Fig. A.3), even though all of them are clearly detected at this wavelength. The sharp turn-down/low mid-IR fluxes in objects like 13-1250, 21392541+5733202, 21395813+5728335, and 21-2006 (Fig. A.3) are also confirmed by Herschel/PACS. In particular, 13-1250 shows a remarkably steep SED in the far-IR, a strong silicate feature and low mid-IR fluxes, suggestive of a disk gap. A low far-IR flux could indicate a low dust mass and/or strong flattening of the disk beyond what we had assumed in Spitzer-based models. The star 21374275+5733250 (Fig. A.2) also shows relatively lower-than-expected fluxes in the far-IR, although since it is surrounded by nebulosity very close to the bright binary CCDM J2137+5734, its 24 μm flux could be contaminated.
Figure C.1 presents the SEDs including the Herschel data together with our previous disk models derived from optical, Spitzer, and millimetre observations alone. Individual disk modelling is beyond the scope of this paper. Further millimetre-wave observations are essential to study the global evolution of these objects in more detail. The 70 and 160 μm model flux predictions for objects such as 13-236, 13-52, 24-1796 are in excellent agreement with the observations. In cases such as 213930129+572651433, the upper limits favour an interpretation of the disk in terms of a relatively low-mass/low-flaring, and not simply as a massive but very settled disk. There is some disagreement (around 30%) between predicted and observed fluxes (or upper limits) in 92-393, 11-1209, 213929250+572530299 (model predictions slightly higher than observed), and 213735713+573258349 (model prediction sligthly lower than observed). This confirms that, although subject to strong uncertainties in the disk mass and dust grain properties, the mid-IR based SED classification offers a powerful prediction of the global evolutionary status of most protoplanetary disks.
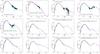 |
Fig. C.1
Comparison of some of the Spitzer-based SED models (pink lines; Sicilia-Aguilar et al. 2011, 2013a,b) and predicted 70/160 μm fluxes with the actual Herschel/PACS observations. Filled symbols mark detections at different wavelengths. Errorbars are shown in blue for both photometry points (often smaller than the symbols) and the IRS spectra. Upper limits are marked as inverted open triangles. Marginal detections (close to 3σ or affected by nebulosity) are marked as open circles. A photospheric MARCS model is displayed as a dotted line for comparison. |
| Open with DEXTER | |
© ESO, 2014
Current usage metrics show cumulative count of Article Views (full-text article views including HTML views, PDF and ePub downloads, according to the available data) and Abstracts Views on Vision4Press platform.
Data correspond to usage on the plateform after 2015. The current usage metrics is available 48-96 hours after online publication and is updated daily on week days.
Initial download of the metrics may take a while.