Fig. C.1
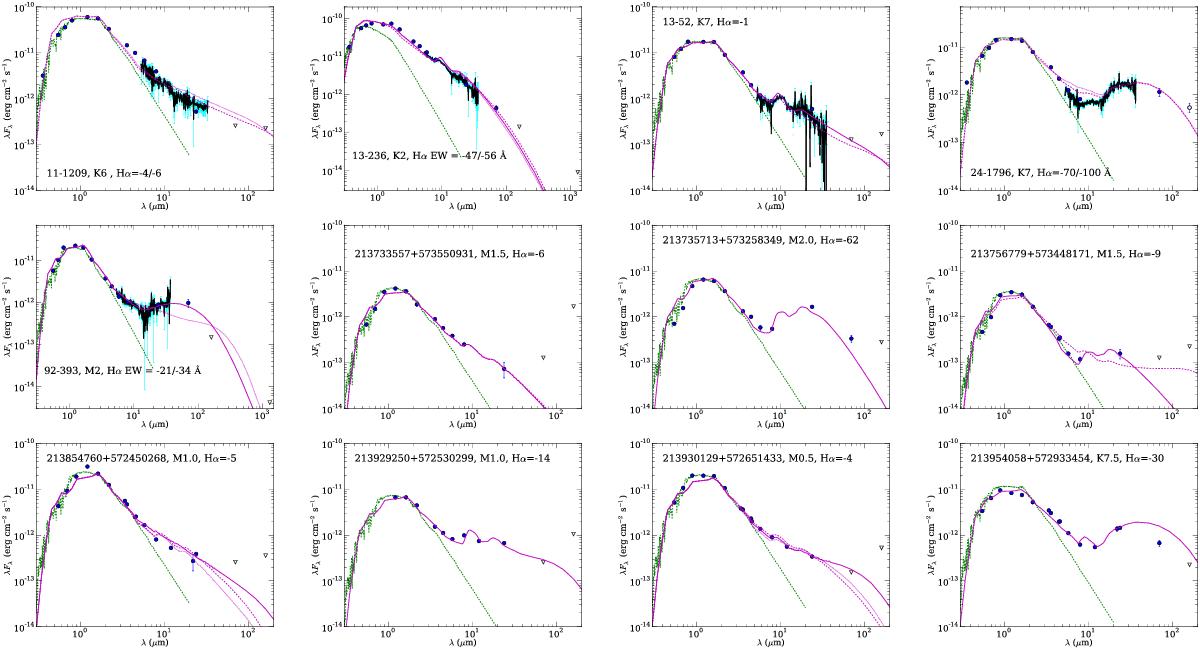
Comparison of some of the Spitzer-based SED models (pink lines; Sicilia-Aguilar et al. 2011, 2013a,b) and predicted 70/160 μm fluxes with the actual Herschel/PACS observations. Filled symbols mark detections at different wavelengths. Errorbars are shown in blue for both photometry points (often smaller than the symbols) and the IRS spectra. Upper limits are marked as inverted open triangles. Marginal detections (close to 3σ or affected by nebulosity) are marked as open circles. A photospheric MARCS model is displayed as a dotted line for comparison.
Current usage metrics show cumulative count of Article Views (full-text article views including HTML views, PDF and ePub downloads, according to the available data) and Abstracts Views on Vision4Press platform.
Data correspond to usage on the plateform after 2015. The current usage metrics is available 48-96 hours after online publication and is updated daily on week days.
Initial download of the metrics may take a while.