Fig. A.5
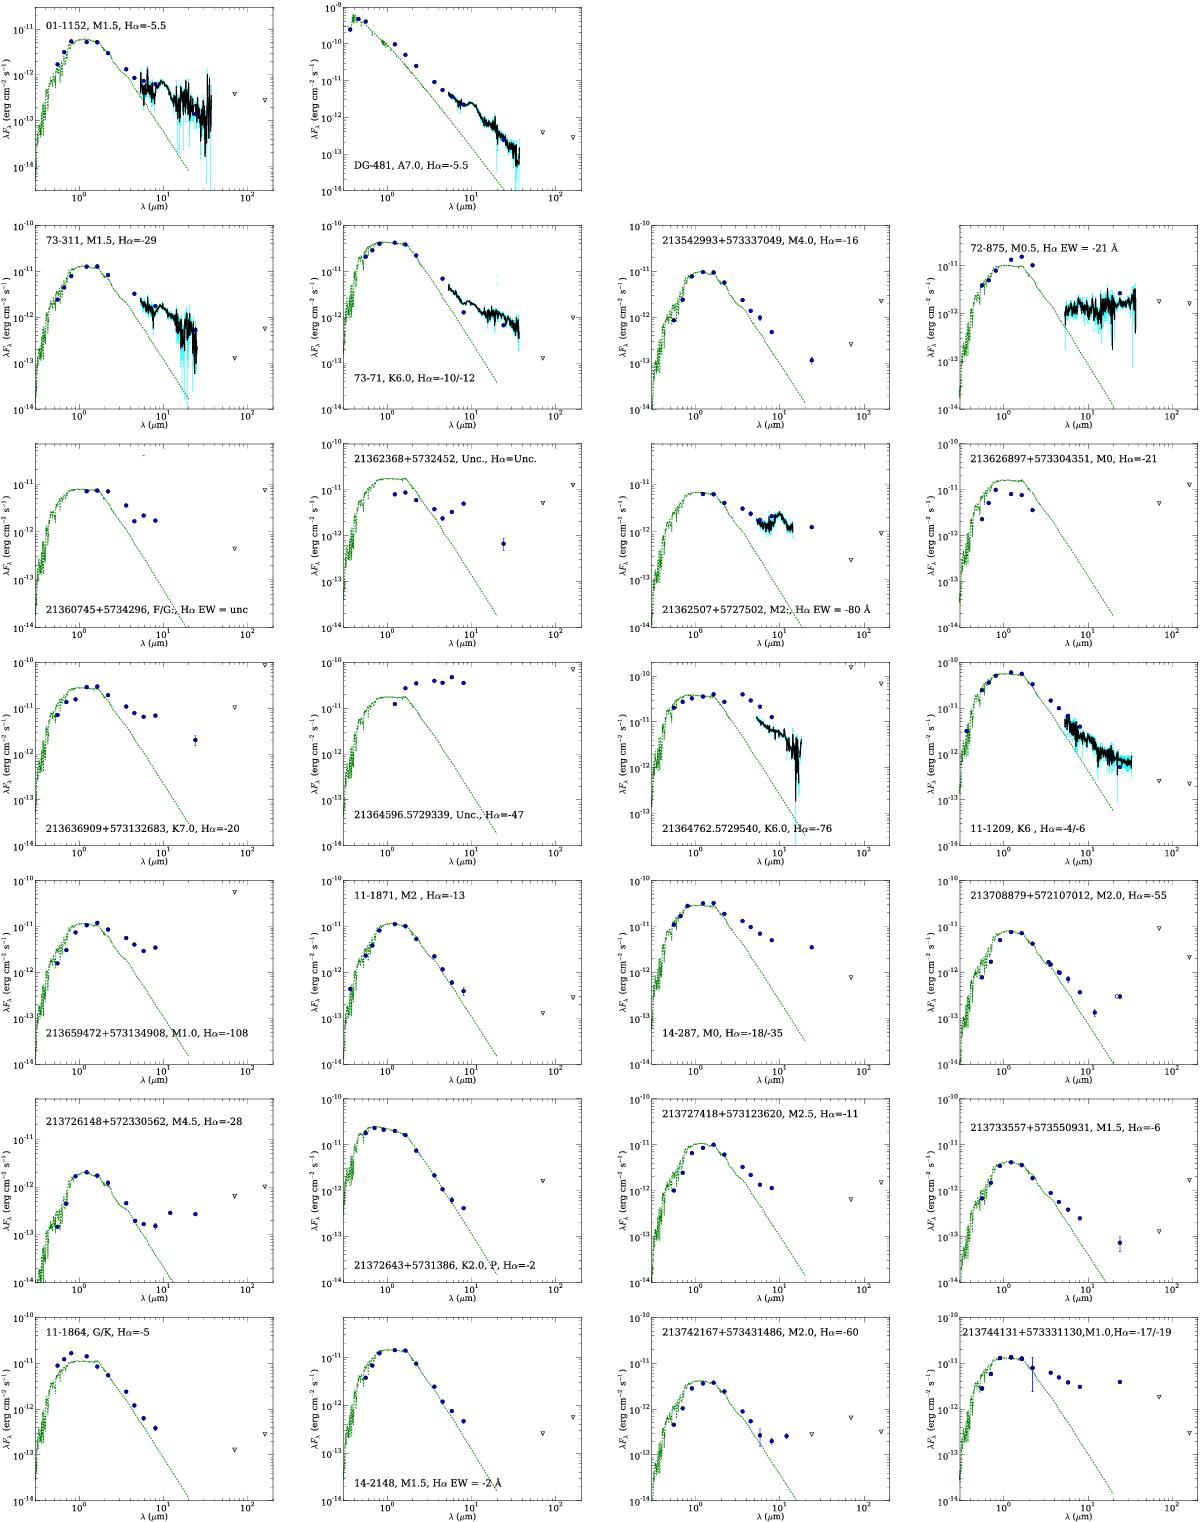
SEDs of the objects with upper limits only. The first two objects are in the NGC 7160 cluster, the rest are in Tr 37. Only objects with confirmed disks (Spitzer excesses) are displayed. Filled symbols mark detections at different wavelengths. Errorbars are shown in blue for both photometry points (often smaller than the symbols) and the IRS spectra. Upper limits are marked as inverted open triangles. Marginal detections (close to 3σ or affected by nebulosity) are marked as open circles. The information about spectral types and Hα emission from the literature is also listed. A photospheric MARCS model is displayed for comparison.
Current usage metrics show cumulative count of Article Views (full-text article views including HTML views, PDF and ePub downloads, according to the available data) and Abstracts Views on Vision4Press platform.
Data correspond to usage on the plateform after 2015. The current usage metrics is available 48-96 hours after online publication and is updated daily on week days.
Initial download of the metrics may take a while.